Indifference Curves: The Consumer Tastes
Suppose we ask the consumer what his preferences are for alternative bundles of two goods, say food and clothing. Certain combination of the two goods may be equally desirable to him. For example, he may be indifferent between a combination of 2 units of food and 6 units of clothing arid a combination of 4 unit of food and 3 unit of clothing. This generates a preference ranking for a wide range of possible market baskets or bundle of goods. Table 3.4 shows some possible bundles which are equally desirable to the consumer. Indifference curves are formed by a graphic presentation of these combinations. Fig 3.7 depicts a number of consumer indifference curves representing consumers' scale of preferences. An indifference curve shows all combinations of two goods among which the individual is indifferent since they yield equal satisfaction to the consumer.
Table 3.4: Indifference Schedule
|
Combination
|
Food(x)
|
Clothing(Y)
|
MRSYX=DY/DX
|
|
A
|
1
|
12
|
-
|
|
B
|
2
|
6
|
-6
|
|
C
|
3
|
4
|
-2
|
|
D
|
4
|
3
|
-1
|
In Fig. 3.7 indifference curve I2 shows that combination B (2 unit of food and n unit of clothing) and combination C (3 unit of food and 4 unit of clothing) are equally desirable, as they yield same satisfaction. On the other hand, points on indifference curve I3 yield a higher level of satisfaction and I4 a still higher level. Indifference curves give an ordinal (rank) measure of utility. That is, we know that I4 > I3 > I2 > I1 but not by how much.
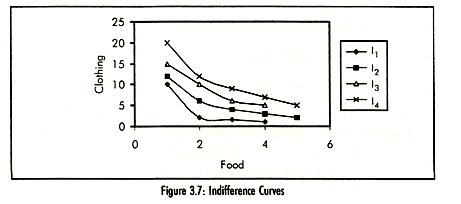
It is observed that, some consumers may value an extra unit of a particular good highly while others may not. The marginal rate of substitution (MRS) measures the relative importance attached by the consumer to the acquisition of additional unit of a good. The MRS is the rate at which one good can be substituted for another to maintain the same level of satisfaction. It measures the slope of two combinations between any two points. For this reason, indifference curves are negatively sloped. This identifies the trade off of one good for another which the consumer is willing to make independent of the prices of two goods, which indicates the trade off conditions required by the market. The rate at which consumers are willing to trade off one product for another can be altered by changing their tastes. Here advertising and other forms of promotion can be useful.
In our example, the amount of clothing that the individual would be willing to give up for an additional unit of food is the MRS of clothing for food (MRSyx) As a result, the indifference curve I2 is negatively sloped. It can further be observed from Table 3.4 that the consumer is willing to forego 6 units of clothing for an additional unit of food. Then he gives up 2 units of clothing for an additional unit of food and so on. Therefore the MRS between points A and B is 6 units, and 2 units between B and C. This means that the consumer is willing to forego less and less of the good being substituted (clothing in this example). This is due to the diminishing MRS.
The MRS diminishes because goods are not perfect substitutes the additional utility derived from an additional quantity of a good decreases fast in relation to me other commodity whose total quantity is being decreased. Thus, as the consumer moves down the indifference curve, the MRS decreases. The diminishing MRS gives convex shape to the indifference curve.
From the previous discussion we can say that the indifference curves:
- are negatively sloped,
- are convex to the origin,
- do not intersect each other and
· placed higher, represent a higher level of satisfaction.
If two indifference curves cross each other it would mean that two equal combinations of two goods yield two different levels of satisfaction. In other words, a larger and a lower level of satisfaction is given by an indifference curve. This is not possible as all points on an indifference curve yield same level of satisfaction.