Graph, Mathematics

Assignment Help:

Now we need to discuss graphing an equation. The first question which we have to ask is what accurately is a graph of an equation?  A graph is the set of all the ordered pairs whose coordinates satisfy the equation.

For example, the point( 2, -3) is a point on the graph of y = ( x -1)2  - 4 whereas (1, 5) isn't on the graph. How do we tell this?  All we ought to do is take the coordinates of the point and plug them into the equation to see if they satisfy the equation.  Let's do that for both to check the claims made above.

(2, -3) :

In this case we have x= 2 and y = -2 thus plugging in gives,
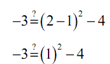
2284_Graph.png

                                               -3 = -3              OK

Thus, the coordinates of this point satisfies the equation and therefore it is a point on the graph.

(1, 5) :

Here we have x = 1 and y = 5 .  Plugging these in gives,

                                              1923_Graph1.pngNOT OK

The coordinates of this point do not satisfy the equation & so this point isn't on the graph.

Now, how do we sketch the graph of an equation? Certainly, the answer to this based on just how much you know regarding the equation to start off with.  For example, if you know that the equation is a line or a circle we've got easy ways to find out the graph in these cases. There are also several other kinds of equations that usually we can get the graph from the equation without a lot of work.  We will see several of these in the next chapter.

Though, let's assume that we don't know ahead of time just what the equation is or any of the ways to rapidly sketch the graph.  In these cases we will have to recall that the graph is simply all the points which satisfy the equation.  Thus, all we can do is plot points.  We will pick values of x, calculate y from the equation & then plot the ordered pair given by these two values.

How, do we find out which values of x to select? Unluckily, the answer there is we guess. We pick some values & see what we get for a graph. If it looks as we've got a nice good sketch we stop.  If not we pick some more.  Knowing the values of x to choose is really something which we can just get with experience & some knowledge of what the graph of the equation will maybe look like.  Optimistically, you will have acquired some of this knowledge.


Related Discussions:- Graph

What percent of the figure below is shaded, What percent of the figure belo...

What percent of the figure below is shaded? Break the rectangle into eighths as shown below. The shaded part is 6/8 or 3/4 ; 3/4 is 75%.

Dividing fractions by fractions with drawing.., how do I divide a fraction ...

how do I divide a fraction by a fraction by drawing a picture

In terms of x what is the total number of miles they rode, Noel rode 3x mil...

Noel rode 3x miles on his bike and Jamie rode 5x miles on hers. In terms of x, what is the total number of miles they rode? The terms 3x and 5x are such as terms since they hav

Produce the individual answers and the insights in maths, It is difficult t...

It is difficult to produce the individual answers and the insights that they were providing. But, let's look at some broad patterns that we found, which are similar to those that o

Expected value, Expected Value For taking decisions under conditions of...

Expected Value For taking decisions under conditions of uncertainty, the concept of expected value of a random variable is used. The expected value is the mean of a probability

Sequence, how to find the indicated term?

how to find the indicated term?

Determine the relative global error, Consider the differential equation giv...

Consider the differential equation give by y′ = -10(y - sin t) (a) Derive by hand exact solution that satis?es the initial condition y(0) = 1. (b) Numerically obtain the s

Rate and ratio, express 4:24 as fraction in lowest term

express 4:24 as fraction in lowest term

Kurtosis-measure of central tendency, Kurtosis - It is a concept, whic...

Kurtosis - It is a concept, which refers to the degree of peakedness of a described frequency distribution. The degree is generally measured along with reference to general di

Write Your Message!

Captcha
Free Assignment Quote

Assured A++ Grade

Get guaranteed satisfaction & time on delivery in every assignment order you paid with us! We ensure premium quality solution document along with free turntin report!

All rights reserved! Copyrights ©2019-2020 ExpertsMind IT Educational Pvt Ltd