Explain the Three Liquids - Ternary Phase Diagram?
Figure on the next page is the ternary phase diagram of a system of ethanol, benzene, and water at a temperature and pressure at which the phases are liquids. When the system point is in the area labelled P=1, there is a single liquid phase whose composition is de- scribed by the position of the point. The one-phase area extends to the side of the triangle representing binary mixtures of ethanol and benzene, and to the side representing binary mixtures of ethanol and water. In other words, ethanol and benzene mix in all proportions, and so also do ethanol and water. When the overall composition is such that the system point falls in the area labeled P=2, two liquid phases are present. The compositions of these phases are given by the positions of the ends of a tie line through the system point. Four representative tie lines are included in the diagram, and these must be determined experimentally. The relative amounts of the two phases can be determined from the lever rule. 7 In the limit of zero mole
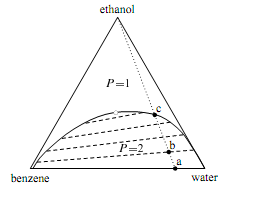
Figure: Ternary phase diagram for ethanol, benzene, and water at 30°C and 1 bar. The dashed lines are tie lines; the open circle indicates the plait point.
fraction of ethanol, the tie line falls along the horizontal base of the triangle and displays a miscibility gap for the binary system of benzene and water. (The conjugate phases are very nearly pure benzene and pure water). The plait point shown as an open circle in the figure is also called a critical solution point. As the system point approaches the plait point from within the two-phase area, the length of the tie line through the system point approaches zero, the miscibility gap disappears, and the compositions of the two conjugate liquid phases become identical. Suppose we have the binary system of benzene and water represented by point a. Two liquid phases are present: one is wet benzene and the other is water containing a very small mole fraction of benzene.
If we gradually stir ethanol into this system, the system point moves along the dotted line from point a toward the vertex for pure ethanol, but can never quite reach the vertex. At point b, there are still two phases, and we can consider the ethanol to have distributed itself between two partially-miscible solvents, benzene and water. From the position of point b relative to the ends of the tie line passing through point b, we see that the mole fraction of ethanol is greater in the water-rich phase. As we continue to add ethanol, the amount of the water-rich phase increases and the amount of the benzene-rich phase decreases, until at point c the benzene-rich phase completely disappears. The added ethanol has increased the mutual solubility of benzene and water and resulted in a single liquid phase.