Expected-utility maximizer, Advanced Statistics

Assignment Help:

There are two periods. You observe that Jack consumes 100 apples in period t = 0, and 120 apples in period t = 1. That is,

(c0; c1) = (100; 120)

Suppose Jack has the utility function:

U(c0; c1) = u(c0) + u (c1)

where the felicity function u has the power form. Notice that Jack does not discount the future.

Savings carry 1 percent interest.

(i) Assume that Jack did not face any borrowing constraints when making his choice. What is the that is consistent with Jack's chosen consumption pro le?

(ii) Assume now that Jack could not borrow as much as he wanted when he chose the above consumption allocation. Draw a graph that depicts this scenario. Derive a lower bound for Jack's .

(iii) Relate your answers to the risk-free rate puzzle.

Problem:

Consider the following utility function for money:

1241_utility function1.png

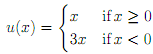
Consider the Samuelson gamble in which with equal probability you win $200 or lose $100.

(i) Show that an expected-utility maximizer with the above utility function u(x) will turn down a single play of the gamble, but will accept three such gambles.

(ii) if you are ambitious..., is any n-fold repetition accepted, where n  3?

(iii) How does this problem relate to Samuelson's claim that accepting a large number of IID gambles while rejecting a single one is a 'fallacy of large numbers'?

Problem

Benartzi and Thaler recount the following experience. When consulting a large investment company, they confronted each fund manager with a simple gamble. The majority of the fund managers rejected the gamble. The CEO of the company noted that he would prefer if all the managers had accepted their gamble. How does this anecdote relate to Samuelson's IID paradox and his discussion of the fallacy of large numbers?

Problem

An expected-utility maximizer whose utility for money is increasing is indifferent between $40 and the lottery (1=2; 0; 1=2; 100). He is also indi erent between $105 and the lottery (1=2; 0; 1=2; 220). Is the individual risk-averse?

Problem An asset pays $5 in state !1 and $2 in state !2. A 'maxmin' investor believes that the probability of state !1 lies in the interval [1=3; 2=3].

(i) What is the highest price at which the investor will be willing to buy the asset?

(ii) What is the minimal price at which the investor will be willing to short sell the asset?

(iii) For what range of prices does the investor stay out of the market?

Problem

Jack uses the following utility-function when making consumption-savings decisions under uncertainty:
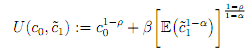
522_utility function.png

(i) How should the parameter  be interpreted?

(ii) How should the parameter be interpreted?

(iii) Suppose we use the above utility speci cation to address the equity premium puzzle. What values for α, p do you expect to fi nd?


Related Discussions:- Expected-utility maximizer

Define non linear mapping (nlm), Non linear mapping (NLM ) is a technique f...

Non linear mapping (NLM ) is a technique for obtaining a low-dimensional representation of the set of multivariate data, which operates by minimizing a function of the differences

Explain kendall''s tau statistics, Kendall's tau statistics : The measures ...

Kendall's tau statistics : The measures of the correlation between the two sets of rankings. Kendall's tau itself (τ) is the rank correlation coefficient based on number of inversi

Population averaged models, Population averaged models are the models for ...

Population averaged models are the models for kind of clustered data in which the marginal expectation of response variable is the main focus of interest. An alternative approach

The time series analysis on the number of babies, importance of time series...

importance of time series on the number of babies given birth

Describe length-biased sampling, Length-biased sampling : The bias which ar...

Length-biased sampling : The bias which arises in the sampling scheme based on the visits of patient, when some individuals are more likely to be chosen than others simply because

Log-linear models, Log-linear models is the models for count data in which...

Log-linear models is the models for count data in which the logarithm of expected value of a count variable is modelled as the linear function of parameters; the latter represent

Procrustes analysis, Procrustes analysis is a technique of comparing the a...

Procrustes analysis is a technique of comparing the alternative geometrical representations of a group of multivariate data or of the proximity matrix, for instance, two competing

Mardia''s multivariate normality test, Mardia's multivariate normality test...

Mardia's multivariate normality test is a test that a set of the multivariate data arise from the multivariate normal distribution against departures due to the kurtosis. The test

Chance events, Chance events : According to the Cicero these are events whi...

Chance events : According to the Cicero these are events which occurred or will occur in ways which are the uncertain-events which may happen, may not happen, or may happen in some

Inferetial statistics, wat iz z difference b/n logistic regression and mul...

wat iz z difference b/n logistic regression and multiple regression analysis /

Write Your Message!

Captcha
Free Assignment Quote

Assured A++ Grade

Get guaranteed satisfaction & time on delivery in every assignment order you paid with us! We ensure premium quality solution document along with free turntin report!

All rights reserved! Copyrights ©2019-2020 ExpertsMind IT Educational Pvt Ltd