Equilibrium in a single market model, Managerial Economics

Assignment Help:

Equilibrium in a single market model

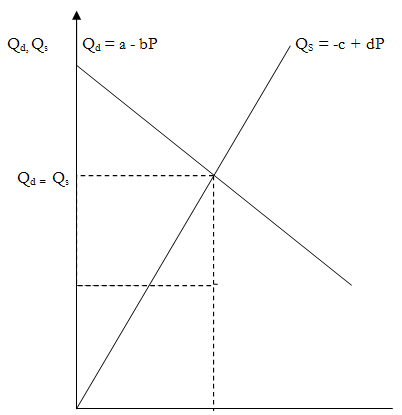
A single market model has three variables: the quantity demanded of the commodity (Qd), the quantity supplied of the commodity (Qs) and the price of the commodity (P).  equilibrium is assumed to hold in the market when the quantity demanded (Qd) = Quantity Supplied (Qs) .  It is assumed that both Qd and Qs are functions.  A function such as y = f (x) expresses a relationship between two variables x and y such that for each value of x there exists one and only one value of y.  Qd is assumed to be a decreasing linear function of P which implies that as P increases, Qd decreases and Vice Versa.  Qs on the other hand is assumed to be an increasing linear function of P which implies that as P increases, so does Qs.

Mathematically, this can be expressed as follows:

Qd = Qs

Qd = a - bP where a,b > 0. ............................(i)

Qs = -c + dp where c,d >0. ...........................(ii)

Both the Qd and Qs functions in this case are linear and can be expressed graphically as follows:

850_one market model.png

Once the model has been constructed it can be solved.

At equilibrium,

Qd = Qs

\a - bP = -c + dP

2342_Untitled.png = a + c

        b + d

To find the equilibrium quantity 2007_supply.png, we can substitute into either function (i) or (ii).

Substituting 2342_Untitled.png into equation (i) we obtain:

2007_supply.png = a - b (a+c) = a (b+d) - b (a+c) = ad -bc

              b + d                 b + d             b + d

Taking a numerical example, assume the following demand and supply functions:

2342_Untitled.png = 100 - 2P

Qs = 40 + 4P

At equilibrium, Qd = Qs

100 - 22342_Untitled.png = 40 + 42342_Untitled.png

              62342_Untitled.png = 60

            2342_Untitled.png = 10

Substituting P = 10, in either equation.

Qd = 100 - 2 (10) = 100 - 20 = 80 = Qs

A single market model may contain a quadratic function instead of a linear function.  A quadratic function is one which involves the square of a variable as the highest power.  The key difference between a quadratic function and a linear one is that the quadratic function will yield two solution values.


In general, a quadratic equation takes the following form:

ax2 + bx + c = 0 where a ¹ 0.

Its two roots can be obtained from the following quadratic formula:

X1, X2 = -b + ( b2 - 4ac)

                        2a

Given the following market model:

Qd = 3 - P2

2 = 6P - 4

At equilibrium:

3 - P2 = 6P - 4

P2 + 6P - 7 = 0

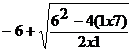
Substituting in the quadratic formula:

a =1, b = 6, c = -7

= - 6 +Ö 62 - 4 (1 x - 7)

                2 x 1

1000_supply1.png

P = 1 or -7 (ignoring -7 since price cannot be negative)

2342_Untitled.png = 1

Substituting 2342_Untitled.png = 1 into either equation:

Qd = 3 - (1)2 = 2 = Qs

2007_supply.png = 2


Related Discussions:- Equilibrium in a single market model

An optimum population, An optimum Population Countries are often descr...

An optimum Population Countries are often described as under populated or overpopulated.  From the economist's viewpoint these terms do not refer to the population density (i.

Domestic workers to domestic firms, Labor demand for low-skilled workers in...

Labor demand for low-skilled workers in the United States is w= 24 -0.1E where E is the number of workers (in millions) and w is the hourly wage. There are 120 million domestic U.S

Quadratic cost function, Using the CD data estimate a quadratic cost functi...

Using the CD data estimate a quadratic cost function. Test the hypothesis that there is diminishing marginal cost. Be sure to state what critical value you are using. Then, using t

The law of diminishing returns (law of variable proportions), THE LAW OF DI...

THE LAW OF DIMINISHING RETURNS  (LAW OF VARIABLE PROPORTIONS) One of the most important and fundamental principles involved in economics called the law of diminishing return

Individual and market demand schedule, Individual and market demand schedul...

Individual and market demand schedule The plan of the possible quantities that will be demanded at different prices by an individual is called Individual demand schedule. Su

Indifference curve, Case study for consumer behavior using indifference cur...

Case study for consumer behavior using indifference curev

Firm and industry supply schedules, Firm and industry supply schedules ...

Firm and industry supply schedules The plan or table of possible quantities that will be offered for sale at different prices by individual firms for a commodity is called su

Shift in the supply curve, Shifts in the supply curve Shifts in the su...

Shifts in the supply curve Shifts in the supply curve are brought about by changes in factors other than the price of the commodity. A shift in supply is indicated by an entir

Show normal profit equilibrium, Q. Show Normal profit equilibrium? Nor...

Q. Show Normal profit equilibrium? Normal Profits: With the condition of  MC = MR and MC cuts the MR from below, if E is the point of stable equilibrium, output of firm is OM

General and selective credit control, General and Selective Credit Control ...

General and Selective Credit Control These are imposed with the full apparatus of the law or informally using specific instructions to banks and other institutions.  For insta

Write Your Message!

Captcha
Free Assignment Quote

Assured A++ Grade

Get guaranteed satisfaction & time on delivery in every assignment order you paid with us! We ensure premium quality solution document along with free turntin report!

All rights reserved! Copyrights ©2019-2020 ExpertsMind IT Educational Pvt Ltd