Derivation of indifference curve, Macroeconomics

Assignment Help:

Derivation of Indifference Curve:

Consider any commodity bundle denoted by point A in the above figure which consist x01 and x02 amount of good I and good II respectively and from which consumer obtains particular level of utility, say U0. We compare the commodity bundle 'A' with other commodity bundle in the commodity space. For that we divide the entire commodity plane into four phases from 'A'.  Consider any point in phase I say β, where we have large quantity of both x1 and x2 compared to point 'A'. Again, if we consider any point say 'a' in horizontal line in phase I, we have larger quantity of x1 with same quantity of x2 compared to point 'A'. Similarly, for any point 'b' in vertical axis, we have larger x2 with same x1. That means in phase I including the borderlines, we have larger quantity of at least one commodity and no less quantity of any other commodity compared to 'A'. Thus, we have larger utility in phase I including the borderlines compared to 'A'. 


1565_Derivation of Indifference Curve.png

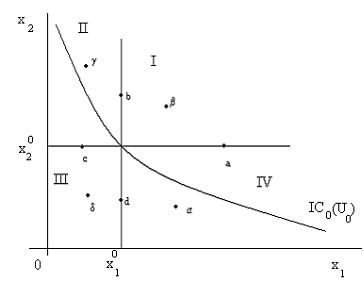
By similar logic, we have lower consumption of at least one good and no larger consumption of any other good in phase III including the borderlines compared to point 'A'. Hence, we have lower level of utility in phase III including the borderlines compared to 'A' by the axiom of non-satiation for all goods. 

Clearly, in phases I and III, including borderlines, utility is not constant between the commodity bundles compared to point 'A'. So, indifference curve (along which utility is constant) can't pass through phases I and III including their borderlines. 

Consider any point in phase IV excluding borderlines, say α. We have larger x1 (for which utility is larger) and lower x2 (for which utility is lower) compared to 'A'. Since both goods are non-satiated, utility of point α may be larger, lower or equal compared to point 'A'. Similarly, for any point in phase II excluding the borderlines, say  δ, we have larger consumption of x2 but lower of x1 compared to point 'A'. Therefore, by axiom of non-satiation in all goods, utility at point δ may be larger, lower or equal compared to 'A'. 

Clearly, only in phases II and IV excluding the borderlines, there is a possibility of the same level of utility between the bundles compared to point 'A'. So, indifference curve, along which utility remains unchanged, must pass through the phase II and phase IV, excluding their lines. Thus, indifference curve is necessarily downward sloping where all goods are non-satiated given that a consumer choice is continuous, reflexive and complete.  


Related Discussions:- Derivation of indifference curve

Baumal''s sales revenue maximizaion mode4l, Revenue Maximisation Assignment...

Revenue Maximisation Assignment Help Objectives of the Firm - Baumol''s Model of Sales Revenue Maximisation Baumol''s Model of Sales Revenue Maximisation Baumol presented sales r

Keynes liquidity Preference theory stipulates that m, #questionKeynes liqui...

#questionKeynes liquidity Preference theory stipulates that money demand is negatively related to current income and positively related to interest rate..

Employment population ratio, The employment-population ratio gives the numb...

The employment-population ratio gives the number of people: Select one: a. working. b. working as a percentage of the number of people available to work. c. in the labor force.

Determine the exchange rate, Q. Determine the Exchange rate? Exchange r...

Q. Determine the Exchange rate? Exchange rate is determined by the ratio of domestic price level to the foreign price level. If, for instance domestic prices increase by 10% wh

Why are economic models uses for trade-offs and trade, Why are Economic Mod...

Why are Economic Models uses for Trade-offs and Trade? Simplified representations of actuality a. production possibility frontier b. comparative advantage c. circular-

Classical model, using a graph of the classical labour market,illustrate th...

using a graph of the classical labour market,illustrate the effects of a real wage existing in the market that is lower than the equilibrium real wage.What will eventually happen i

What is total surplus in net gain, What is total surplus in net gain? T...

What is total surplus in net gain? Total surplus in net gain: The total surplus generated into a market is the total net gain to consumers and producers through trading into

Aggregate supply - long run equilibrium:graphical analysis, Long Run Equili...

Long Run Equilibrium:Graphical Analysis In the long run the natural rate of output is the level of output to which the economy will tend to adjust in the long run. This indicat

Write Your Message!

Captcha
Free Assignment Quote

Assured A++ Grade

Get guaranteed satisfaction & time on delivery in every assignment order you paid with us! We ensure premium quality solution document along with free turntin report!

All rights reserved! Copyrights ©2019-2020 ExpertsMind IT Educational Pvt Ltd