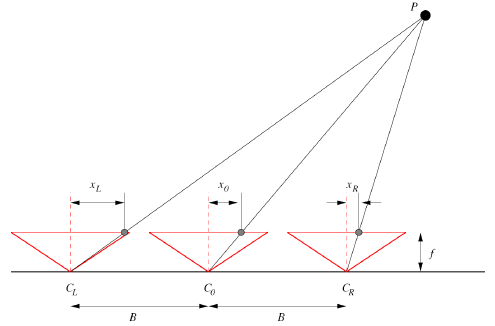
1. In Figure there are three cameras where the distance between the cameras is B, and all three cameras have the same focal length f. The disparity dL = x0 - xL, while the disparity dR = xR - x0. Show that |dL| = |dR|. You should prove this relationship holds mathematically by using the appropriate equations.
2. Consider two points A and B in a simple stereo system. Point A projects to Al on the left image, and Ar on the right image. Similarly there is a point B which projects to Bl and Br. Consider the order of these two points in each image on their epipolar lines. There are two possibilities; either they ordered on the epipolar lines in the same order; for example they appear as Al, Bl and Ar Br, or they are in opposite order, such as Bl, Al and Ar,Br. Place the two 3d points A and B in two different locations in a simple stereo diagram which demonstrates these two possibilities. (Draw a different picture for each situation).
3. The equation of a simple stereo system is z = f T / d. In this question assume that f T = 1 which means that z = 1 / d. Assume that the only source of error in a simple stereo system is the error in estimating the disparity, and that this error is exactly one pixel, and it does not change with the actual disparity value. So if the stereo system says the disparity is 5 pixels it is really between 4 and 6 pixels. Similarly, if the stereo system says the disparity is 10 pixels then it is really between 9 and 11 pixels. The error in estimating Z at a given disparity d due to this one pixel error in estimating the disparity is called ErrorZ. For a given value of disparity d, this error is estimated by the formula FirstErrorZ (d pixels) = || z(d - 1) - z(d + 1)||. Compute FirstErrorZ (5 pixels), FirstErrorZ (10 pixels), and the ratio of the two, which is FirstErrorZ (5 pixels) /FirstErrorZ (10 pixels).
Repeat this entire process but now assume that the error in calculating the disparity is ½ pixel, so that SecondErrorZ (d pixels) = || z(d - 1/2) - z(d + 1/2)||. Again compute SecondErrorZ (5 pixels), SecondErrorZ (10 pixels). Now compute the ratio of the two, which is SecondErrorZ (5 pixels) /SecondErrorZ (10 pixels). Looking at this ratio you should hypothesize a relationship between error in Z and error in disparity which holds as the error in disparity (1,1/2,..) approaches zero. In other words, given a small fixed error in computing the disparity, how does the resulting error in computing Z change if the d disparity is cut in half. Verify that your hypothesis is true by computing the derivative of Z with respect to disparity d in the case where z = 1/d, which represents the change in depth over the change in disparity (in the limit as the change in disparity goes to zero). The theory should agree with the practice.
4. There is a simple stereo system with one camera placed above the other camera in the y direction (not the x direction is as usual) by a distance of b. In such a case there is no rotation between the cameras, only a translation by a vector T = [0,b,0]. First compute the essential matrix E in this case. You are given a point p1 in camera co-ordinates in the first image as (x1,y1,f), and a matching point p2 in the second image where p2 is (x2,y2,f). Write the equation of the epipolar line that contains the matching point p2 in camera co-ordinates in the second image. In this case you are given p1 and you have computed E, and you need to write the equation of the line that contains p2 (the free variables are x2,y2) using p1 and E as the fixed variables. Now repeat the entire process again for the case where T = [b,b,0] (a translation of 45 degrees to the right in the x,y plane), and finally where T = [0,0,b] (a translation straight ahead in the Z direction). For the particular case where p1 = (0, 1, f) what is the equation of the epipolar line for all three situations? And where
p1 = (1, 1, f) what is the equation of the epipolar line in these three situations? Draw the epipolar lines for all three cases, you just need to show the basic shape of the epipolar lines.