Write three m ?les to generate M ensemble members of length N, for the following three random processes:
i) function v=rp1(M,N);
a=0.02;
b=5;
Mc=ones(M,1)*b*sin((1:N)*pi/N);
Ac=a*ones(M,1)*[1:N];
v=(rand(M,N)-0.5).*Mc+Ac;
ii) function v=rp2(M,N)
Ar=rand(M,1)*ones(1,N);
Mr=rand(M,1)*ones(1,N);
v=(rand(M,N)-0.5).*Mr+Ar;
iii) function v=rp3(M,N)
a=0.5;
m=3;
v=(rand(M,N)-0.5)*m + a;
Try to understand what kind of signal each process generates and thereby decide which process is ergodic and/or stationary.
- Compute the ensemble mean and standard deviation for each process and plot them as a function of time, using 100 members each of length 100, for each process. Comment on the stationarity of each process.
- Generate 4 members of length 1000 of each process, and measure the mean and standard deviation of each member. Hence comment on the ergodicity of each process.
- Write the mathematical description of each of the three stochastic processes. Calculate the theoretical mean and variance for each case and compare the theoretical results with those obtained by the measurements.
c) Repeat a) but with the randn function which generates a random signal with theoretical ly zero mean and unity standard deviation.
d) The autocorrelation function for a statistically stationary random discrete signal may be calculated from
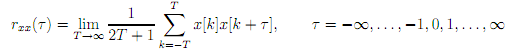
More formally, the discrete signal is implicitly being assumed to be autocorrelation ergodic, that is, the nature of the random signal x is such that the discrete samples themselves can be used to calculate the autocorrelation function. In a real application, only a ?nite number of samples, N, of x will be available and, therefore, it is necessary to make an assumption upon unknown values of x. Usually, these are assumed to be zero. An unbiased estimate of the autocorrelation function can be calculated from
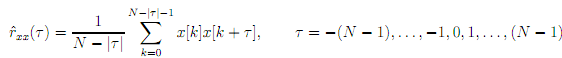
Notice that from a length N vector x,a(2 - 1) length estimated autocorrelation function is obtained.
- Employ the xcorr(x,'unbiased') function within MATLAB to calculate the unbiased estimate of the autocorrelation function for a length 1000 random signal generated with the randn function. Display and explain the result, i.e. is it symmetric and, if so, about which point? Use k = -999:999 for the x axis.
Note: To understand the symmetry in the autocorrelation function, draw a simple ?nite random continuous wave (wave ); below that draw the same wave with a time shift (wave ); below that draw the same wave with time shift - (wave ). Compare the common non-zero regions between and , and the common non-zero regions between and . It is seen that the multiple of the two waves in both non-zero regions is the same.
- Explain what is happening at large | T |
Hint: What happens to the number of non-zero terms on the rhs of the equation? Use the axis command to concentrate upon the region | T | 50. Notice the autocorrelation function is essentially zero for non-zero shifts. This is a fundamental property of such a random signal, that is, the autocorrelation function reveals that there is no correlation between shifted versions of x. In practice, this means that for such a random signal, knowledge of one signal sample has no bearing on any of its past or future values.
The samples are said to be uncorrelated.
In theory, a purely random signal will have an autocorrelation function which is a discrete delta function. This shows that there is no correlation (i.e. similarity) between the random signal and a shifted version of it.