Reference no: EM131415687
Lead in fern moss
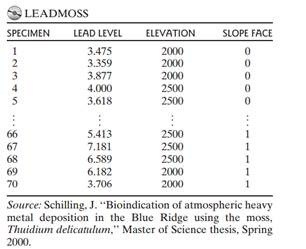
A study of the atmospheric pollution on the slopes of the Blue Ridge Mountains (Tennessee) was conducted. The file LEADMOSS contains the levels of lead found in 70 fern moss specimens (in micrograms of lead per gram of moss tissue) collected from the mountain slopes, as well as the elevation of the moss specimen (in feet) and the direction (1 if east, 0 if west) of the slope face. The first five and last five observations of the data set are listed in the table.
(a) Write the equation of a first-order model relating mean lead level, E(y), to elevation (x1) and slope face (x2). Include interaction between elevation and slope face in the model.
(b) Graph the relationship between mean lead level and elevation for the different slope faces that is hypothesized by the model, part a.
(c) In terms of the β's of the model, part a, give the change in lead level for every one foot increase in elevation for moss specimens on the east slope.
(d) Fit the model, part a, to the data using an available statistical software package. Is the overall model statistically useful for predicting lead level? Test using α = .10.
(e) Write the equation of the complete secondorder model relating mean lead level, E(y), to elevation (x1) and slope face (x2).
|
Write an informative paper that explores that topic
: Choose a topic that is of personal interest and is relevant to adolescent development (suggested topics provided below). Write an informative paper that explores that topic and incorporates research to support your information
|
|
Identify three models of group development
: Identify three models of group development. How does the validity and reliability of a test help us decide if we should or should not use that test? What is needed for information to be considered high quality? Define the concept of garbage-in-garbag..
|
|
Different markets with the demand functions
: A monopolist produces a product in one central production facility using the cost structure: TC = (1/2) Q2 +300 and sells it in two different markets with the following demand functions:
|
|
Discuss possible risk mitigation strategies based on finding
: Discuss possible risk mitigation strategies based on your findings for it security risk management and discussions in case study 1 & 2.ensure your references page contains at least 6 sources. Make sure you are using at least two (2) ADDITIONAL academ..
|
|
Write the equation of a first-order model
: Write the equation of a first-order model relating mean lead level, E(y), to elevation (x1) and slope face (x2). Include interaction between elevation and slope face in the model.
|
|
How would this technique affect the profits of future period
: Explain how WorldCom showed higher profits in the current period by inaccurately classifying expenses as assets. How would this technique affect the profits of future periods?
|
|
Definition of the sex segregation index
: Calculate the index of occupational segregation by sex using the formula given in footnote 5, Chapter 5. Explain exactly what the number you obtained in (a) means in light of the definition of the sex segregation index.
|
|
Discuss why marijuana is a hotly debated drug
: Discuss why marijuana is a hotly debated drug and debate the idea of it as a "gateway" drug. Do you think drugs should be legalized and why
|
|
Why are competitive advantages never permanent
: Discuss briefly the organizational culture and the unique characteristics of Starbucks coffee work environment and the company’s leadership style? what is the impact of purchasing strategy on manufacturing inventory? Identify and analyze the leadersh..
|