Reference no: EM131560721
REGRESSION
SOLVE THE FOLLOWING PROBLEMS IN TWO WAYS:
(a) USING CALCULATOR (by hand) OR EXCEL BASIC COMPUTATIONS
(b) USING MS EXCEL REGRESSION ANALYSIS
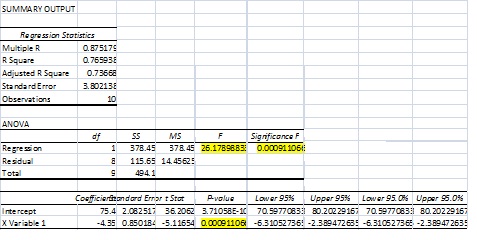
Write out the regression equation.
What is the correlation coefficient?
What is r-square (coefficient of determination)?
Draw the conclusion (very important)
NOTE: In the final you will not be asked to cover all the formulas for regression and correlation. It will be your choice on how you will obtain them, using calculator, using excel regression output, using scatter plots. BUT for the homework please follow closely the solution example and cover ALL the steps.
Solve the following problems as problem sample.
Problem sample:
A researcher is interested in determining whether there is a relationship between number of packs of cigarettes smoked per day and longevity (in years). n=10.
|
# packs of cigarettes smoked
(X)
|
Longevity (Y)
|
|
0
|
|
80
|
|
0
|
|
70
|
|
1
|
|
72
|
|
1
|
|
70
|
|
2
|
|
68
|
|
2
|
|
65
|
|
3
|
|
69
|
|
3
|
|
60
|
|
4
|
|
58
|
|
4
|
|
55
|
A.
1- You are given data for Xi (independent variable) and Yi (dependent variable).
Evaluate ∑X , ∑Y, ∑XY, ∑X2, ∑Y2
2- Calculate the correlation coefficient, r:
3- Calculate the coefficient of determination: r2
4- Calculate the regression coefficient b1 (the slope):
5- Calculate the regression coefficient b0 (the Y-intercept, or constant):
6- The regression equation (a straight line) is:
B. Excel regression analysis
Each of the following problems is worth 20 points; Make sure you that for each problem you give a complete solution that follows the format of the solved problem. The conclusion is very important.
Problem 1: A researcher is interested in determining whether there is a relationship between price and quantity demanded for her firm.
| Price(X) |
Q-demanded(Y) |
| 2 |
95 |
| 3 |
90 |
| 4 |
84 |
| 5 |
80 |
| 6 |
74 |
| 7 |
69 |
| 8 |
62 |
| 9 |
60 |
| 10 |
63 |
| 11 |
50 |
| 12 |
44 |
Problem 2:
A researcher is interested in determining whether there is a relationship between shelf space and number of books sold for her bookstore.
| Shelf Space in feet(X) |
Books Sold(Y) |
| 7 |
280 |
| 3.5 |
140 |
| 4 |
170 |
| 4.2 |
200 |
| 4.8 |
215 |
| 3.9 |
190 |
| 4.9 |
240 |
| 7.5 |
295 |
| 3 |
125 |
| 5.9 |
265 |
| 5 |
200 |
Problem 3:
A researcher is interested in determining whether there is a relationship between grades and hours studied for statistics.
| Hours studied(X) |
Grade on final(Y) |
| 1 |
20 |
| 2 |
30 |
| 4 |
40 |
| 7 |
60 |
| 6 |
65 |
| 7 |
80 |
| 8 |
80 |
| 9 |
95 |
| 8 |
95 |
| 10 |
98 |
Problem 4: A researcher is interested in determining whether there is a relationship between high school average and job performance (the higher the number, the better the performance) at a certain company.
|
High school average (X)
|
Job performance (Y)
|
|
60
|
2
|
|
78
|
5
|
|
98
|
10
|
|
66
|
3
|
|
87
|
8
|
|
77
|
5
|
|
61
|
4
|
|
90
|
6
|
|
91
|
7
|
|
79
|
6
|
|
88
|
7
|
|
99
|
9
|
|
88
|
4
|
|
85
|
8
|
|
81
|
9
|
Problem 5:
A researcher is interested in determining whether there is a relationship between education (in years) and the net income (in thousands of dollars).
|
Education in Years
|
Income (in thousands)
|
|
9
|
20
|
|
10
|
22
|
|
11
|
24
|
|
11
|
23
|
|
12
|
30
|
|
14
|
35
|
|
14
|
30
|
|
16
|
29
|
|
17
|
50
|
|
19
|
45
|
|
20
|
43
|
|
20
|
70
|