Reference no: EM132324318
Programming Project -
1. The data set 'WeightChanges2.xlsx' contains weights of 50 patients measured over a 12 month period. All patients have an initial weight measurement (weight0), but not all are measured the same number of times over the 12 month period.
a. Write a program to correctly import the data as an .xls file and create a SAS data file, named 'weight_mult1'. Create the following new variables:
i) 'months', giving the number of nonmissing months, after the initial month, for which each patient has a weight measurement. (Hint: Use a SAS function.)
ii) 'avg_weight', giving the average of weight1 through weight12 for each patient. Create a label 'average weight' for this variable.
iii) 'weight_class', which categorizes the patients into weight classes, based on their initial weight, as follows:
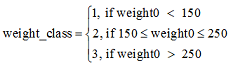
Format this variable so that in all printed output, weight_class will print as 'low' for weight_class 1, 'med' for weight_class 2 and 'high' for weight class 3.
b. Write a program to compute the mean and standard deviation and number of nonmissing observations for 'avg_weight', separately for each of the 'weight_class' groups and create a single table containing the values, making sure the formatted values of weight_class are displayed. Also create a plot containing side-by-side boxplots for the groups. Create separate titles to display for the means table and plot, respectively. Finally, create a PDF file containing the results.
Submit the SAS program, log results and attach the pdf file.
2. Suppose for the data in #1 we are interested in only those patients with three or more weight measurements (after the initial measurement). Generate the same statistics you did in #1(b), for this group only, in two ways:
a) Create a new data file containing only patients with 3 or more measurements and use PROC MEANS to compute the statistics.
b) Leave the file created in #1 intact, and use a WHERE statement in the MEANS procedure to restrict analysis to patients with three or more measurements.
For part (a), turn in the program and the output from a PROC PRINT, showing the contents of the new file, and also the output from PROC MEANS. For part (b), turn in the program and the output from the MEANS procedure.
3. The data from #1 will need to be analyzed using a procedure that requires univariate data representation rather than the current multivariate representation. Modify the DATA step from #1 to create a data file called 'weight_uni', that has a univariate representation of the data (create a variable called 'time' to index the month of measurement. Use PROC CONTENTS to give a summary of the data file.
a) How can you tell from the results of PROC CONTENTS that your program appeared to work?
b) Use PROC PRINT to print the data for the first two patients only. (Note: it is not acceptable to print data for all patients and then print or "cut and paste" only the observations for patients 1 and 2!)
Turn in one program including all parts as well as the output from both PROC CONTENTS and PROC PRINT, and finally the contents of the Log window.
4. Write a SAS program to generate 1000 random values from a Student's t distribution with 2 degrees of freedom, as well as 1000 random values from a standard normal distribution. Generate descriptive statistics for each of the two simulated distributions, as well as side-by-side boxplots of the two simulated distributions (the boxplots must appear in the same plot).
(Hint: Generate both distributions in the same data step, and create a classification variable to identify the distribution.) Submit a copy of the program as well as the output.
Attachment:- Assignment Files.rar