What percentage of pins will be acceptable to the customer

Assignment Help Applied Statistics
Reference no: EM131247805 , Length: 4 Pages

Question One:

The following graph represents the salaries (in $1000) paid to the employees of a certain company.

1798_Figure.jpg

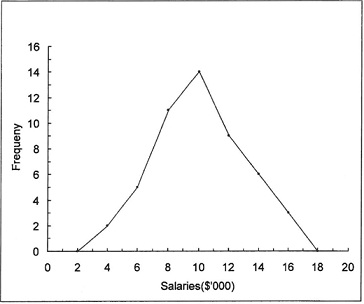
1.1 Extract relevant information from the above graph to estimate each of the following quantities:

1.1.1 Mean salary.

1.1.2 Modal salary.

1.1.3 Coefficient of variation.

1.2 Draw to scale an ogive of the data represented by the above graph and use it to obtain estimates of the 70th percentile and the mid 75% range.

Question Two:

A company supplies specialized, high-tensile pins to a customer. It uses an automatic lathe to produce the pins. Due to factors such as vibration, temperature and wear and tear, the lengths of the pins are normally distributed with a mean of 20.30 mm and a standard deviation of 0.35 mm. The customer will only buy those pins with lengths in the interval 20.00 ± 0.50 mm.

2.1 What percentage of the pins will be acceptable to the customer?

2.2 In order to improve the percentage accepted, management considers adjusting the population mean and standard deviation of the length of the pins. If the lathe can be adjusted to have any desired mean of the lengths, what should it be adjusted to? Why?

2.3 Suppose that the mean (20.30 mm) cannot be adjusted but the standard deviation can be reduced. Calculate the maximum reduction in the standard deviation that would make 80% of the pins acceptable?

2.4 The production manager then considers the costs involved. The cost of resetting the machine to adjust the population mean involves engineering costs and the cost of production time lost. The cost of reducing the population standard deviation involves, in addition to these costs, the cost of overhauling the machine and reengineering the process. Assume it costs $200x2 to decrease the standard deviation by (x/50) mm. Find the cost of reducing the standard deviation to the value found in 2.3.

Question Three:

To better understand its target market, a leading car manufacturer conducted a market survey. A random sample of respondents was chosen, and each was asked to select one of four characteristics (defensive, aggressive, enjoying and prestigious) that best described him or her as a driver. Each respondent was then asked to choose one of three models of its most popular car. The survey results are summarized in the table below.

Mod
e

Defensiv
e

Aggressiv
e

Enjoyin
g

Prestigiou
s

A

27

26

39

61

A

44

50

47

73

C

82

94

101

85

Investigate, at the 5% level of significance, whether a relationship existed between the driver's self-image and choice of model.

Question Four

The quarterly earnings (in $m) of a large soft-drink manufacturer has been recorded for the past four years. The data is listed in the table below:


Year
1

Year
2

Year

 3

Year
4

1st Quarter

72

77

80

86

2nd Quarter

87

95

97

102

3rd Quarter

105

100

k

104

118

4th Quarter

74

81

83

87

Assuming a linear trend in the data, and that the cyclical and irregular components of the time series are negligible, use the ratio-to-moving-average method to estimate the quarterly earnings for year S. Show details of all calculations.

Question Five

A leading pharmaceutical company in the United States is planning on developing a new drug. The development will take place in two phases. Phase I will cost $1.5m and Phase II will cost $2.5m. Any new drug will have to be approved by the Federal Drug Administration (FDA) before it can be marketed. If the drug is approved, then a profit contribution of $7m can be realized by marketing the drug. The only fixed costs to be subtracted from this contribution are the development costs. If the drug is not approved, then all of the development cost has to be written off as a loss.

The managers estimate a 75% chance that the FDA will approve the drug. This still leaves a 25% chance of losing the developmental costs. Because of the risk involved, management proposes that a test be commissioned at the end of Phase I to determine the chances of FDA approval. The test itself will cost $500000. If the test result is positive, then the company will continue with Phase II, otherwise, the project will be aborted. The motivation for the test is that, in case the chances of FDA approval are slim, at least Phase II costs can be saved by aborting the project.

The researcher who conducts the test says that the test is not 100% accurate in predicting whether the FDA will approve the drug. He estimates the following probabilities.

P (Test positive I FDA will approve) = 0.85
P (Test negative I FDA will not approve) = 0.75

With aid of a decision tree, determine the optimal decision strategy the company should adopt.

(Hint: First calculate P(FDA will approve I Test positive) and P(FDA will not approve I Test positive) for the case where the test is conducted. For the case where the test is not conducted, use the nonconditional probabilities of FDA approval and FDA nonapproval.)

Instructions

1. Start each solution on a new page.

2. A spreadsheet (eg. Microsoft Excel) may be used only for the purposes of setting up tables, drawing of graphs etc. All solutions must be clearly shown through the use of appropriate formulae and substitution.

3. Solutions generated by software packages will not be marked.

4. No marks will be awarded if only the final answers are given. All relevant working must be shown.

5. The assignment must be typed using 11pt text font Arial or Times New Roman, spacing of VA lines.

6. It is not necessary to provide references or a bibliography. Number each solution according to the numbering in assignment handbook. NOTE: This instruction applies only to Quantitative Methods.

Reference no: EM131247805

Questions Cloud

Improve the conditions in the telcom rooms : Write an explanation detailing what steps need to be taken to improve the conditions in the telcom rooms and why you should be permitted to have staff work overtime to correct these oversights. Describe what are the TIA/EIA 568 recommendations. Wh..
Is a pi team appropriate as improvement tool in this context : If you do feel that a PI team is appropriate, who do you think should be a member of the PI team?What is your reason for including each member?What role would each member have on the team: leader, member, advisory? Be sure to apply your comments t..
Two concepts from paul and elder : What are two concepts from our readings this What are two concepts from Paul and Elder other than egocentrism that you can apply to the situation you described?
Predict the consequences of unethical behavior in workplace : Write a 350- to 700-word summary of what you have learned about Organizational Behavior from your current readings. Include the following in your summary: Predict the consequences of unethical behavior in the workplace
What percentage of pins will be acceptable to the customer : What percentage of the pins will be acceptable to the customer - In order to improve the percentage accepted, management considers adjusting the population mean and standard deviation of the length of the pins. If the lathe can be adjusted to have ..
Compute the change in consumer surplus : The demand function for widgets is given by D(P) = 16 - 2P. Compute the change in consumer surplus when the price of a widget increases from $1 to $3. Illustrate your result graphically.
Why the demand curve slopes downward : Explain the following to help the committee members understand how markets work: How society manages its scarce resources and benefits from economic interdependence and Why the demand curve slopes downward and the supply curve slopes upward
Analyze the use of an enterprise software systems : Analyze the use of an Enterprise Software Systems (ESS) in a health care organization with regard to its effects on operational outcomes. Select one of the following applications, and recommend three specific ways that the application you selected..
Improve the style of the given paragraph : Improve the style of the following paragraph.  - The migration towards Social Business Processes (SBP)is expected to bring benefits to enterprises.

Reviews

len1247805

10/19/2016 2:01:32 AM

Draw to scale an ogive of the date represented by the above graph and use it to obtain estimates of the 70th percentile and the md 75% range.

Write a Review

Applied Statistics Questions & Answers

  A box of 14 parts contains 5 that are defective

A box of 14 parts contains 5 that are defective. A worker picks parts one at a time and attempts to install them. Find the probability of each outcome in(a) through(d). (a) The first two chosen are both good.

  Create a table reporting the results of the anova

Analyze the data using SPSS. If it is necessary to perform simple main effects, do so. Calculate and report effect sizes and create a table reporting the results of the ANOVA

  The requirement is to write a report about wave equation

the requirement is to write a report about wave equation confinement method through fourier series and finite element

  What conclusion would you draw as a doctor or a nurse

1) How much does a sleeping bag cost? Let's say you want a sleeping bag that should keep you warm in temperatures from 20°F to 45°F. A random sample of prices ($) for sleeping bags in this temperature range is given below. Assume that the population ..

  1multiple choice1 medical care and compensation costs for

1.multiple choice1 medical care and compensation costs for workers injured on the job vary and are strongly skewed. the

  Level of significance to determine whether the proportion of

The U.S. Department of Education reports that 46% of full-time college students are employed while attending college. (Data extracted from "The Condition of Education 2009," National Center for Education Statistics, nces.ed. gov.) A recent survey of ..

  The sample mean

The population mean is within $50.00 of the sample mean?

  The tobacco institute testing laboratory

(1 point) According to data from the Tobacco Institute Testing Laboratory, a certain brand of cigarette contains an average of 1.4 milligrams of nicotine. An advocacy group questions this figure, and commissions an independent test to see if the the ..

  Calculate the slack time for each activity

Calculate the slack time for each activity and for each path and looking at only the critical path, find the probability that the store will take more than 23 working days to open.

  An investor has the following investment portfolio

An investor has the following investment portfolio Z = a1X + a2 Y with a1 + a2 = 1. Where X and Y are random rate of returns of assets X and Y respectively and μx= μy = μ, σx = σy = σ. Assuming that these random variables are not independent find the..

  Determine whether one filter is superior to the other

Two brands of air filters (A and B) for air conditioning units are tested to determine whether one filter is superior to the other. All filters were tested on the same unit

  Fall beyond or between the designated ages/scores

Fall beyond or between the designated ages/scores.

Free Assignment Quote

Assured A++ Grade

Get guaranteed satisfaction & time on delivery in every assignment order you paid with us! We ensure premium quality solution document along with free turntin report!

All rights reserved! Copyrights ©2019-2020 ExpertsMind IT Educational Pvt Ltd