Reference no: EM132299864
QUESTION 1
A published paper by Tuzson et al. (2003) in Archives of Physical Medicine and Rehabilitation (vol. 84, pp. 1363-1368) examined the peak knee velocity in walking (measured in degrees per second) at flexion (x) and extension (y) for 18 subjects with cerebral palsy. The relationship between the two variables is illustrated in the scatter plot below.
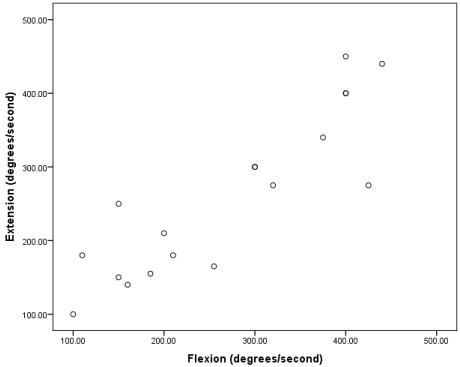
Below are the summary statistics for peak knee velocity at flexion and extension.
∑ x = 4880, ∑y = 4710, ∑x 2 = 1553300, ∑y2 = 1437700 and ∑xy = 1468725
(a) Calculate the sum of squares totals Sxx, Syy, and Sxy.
(b) What is the value of the correlation coefficient r? Comment on the strength and direction of the linear relationship.
(c) What is the equation of the sample linear regression model to predict peak knee velocity at extension?
(d) What is the value of the coefficient of determination? How much variability in knee velocity at extension is explained by knee velocity at flexion?
(e) Below are the Q-Q plot for the residuals (left) and the residual plot (right).
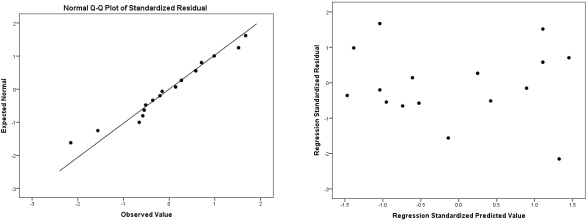
Using the above graphs, comment as to whether the assumption of normality and constant variances are valid for this regression model.
(f) Perform a hypothesis test to test whether to test whether the population slope parameter β1 = 0 (you can use either the t- or ANOVA approach).
(g) What is the expected knee velocity at extension of a subject with cerebral palsy whose knee velocity at flexion was 290 degrees/second?
(h) What is the 95% confidence interval for the knee velocity at extension of a subject with cerebral palsy whose knee velocity at flexion was 290 degrees/second?
(i) What is the 95% prediction interval for the knee velocity at extension of a subject with cerebral palsy whose knee velocity at flexion was 290 degrees/second?
QUESTION 2
Dual-energy X-ray absorptiometry (DXA) is a method that uses X-rays of two different energies to estimate a person's body fat percentage (% body fat). The X-ray scans take approximately 10 minutes and the amount of radiation is very low. The advantage of using this method is that it provides accurate % body fat measurement, along with other information including bone density, lean mass and fat readings for different part of the body (e.g. arms, legs and torso). However, this option can be expensive and is typically only available in medical or research settings, and not to the general public.
The SPSS/PSPP file named "ElderlyPopWA.sav" contains data pertaining to the % body fat, waist circumference (cm), hip circumference (cm), tricep skinfold (mm) and arm girth (cm) measurements of 148 elderly females (mean age 74.3 ± 2.6 years; mean BMI 26.6 ± 3.9 kg/m2) in Western Australia. The majority of women in this study are either overweight or obese (65% with BMI >25 kg/m2). The objective here is to determine whether one can develop a regression model based on waist and hip circumference, tricep skinfold and arm girth measurements for predicting % body fat percentage of elderly women based on these four easier to obtain measurables.
Using the given dataset (you may ignore the age and BMI data), perform multiple linear regression modelling in SPSS and answer the following questions.
(a) What is the multiple correlation coefficient and the coefficient of multiple determination? Explain what each of these terms mean, and comment on their value.
(b) What is the equation of the line of best fit relating the body fat percentage with the other variables?
(c) Examine the ANOVA table in the SPSS output. What are the null and alternate hypotheses corresponding to the results of this ANOVA table? What can you conclude based on the results shown in this table?
(d) Which of the variables are significant predictors of body fat percentage? Explain your reasoning.
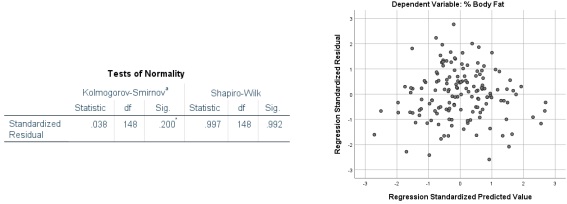
(e) Below are the normality test result on the residuals (left), along with the residual plot (right). Do the assumptions of normality and constant variance hold? Justify.
(f) Predict the body fat percentage of a 45 year old female who has a weight circumference = 75 cm, hip circumference = 82.5 cm, tricep skinfold 17.5 mm and an arm girth of 37 cm. Comment on the validity of this estimate?
QUESTION 3
A study of lower back pain in a particular industry looked at the effect of the type of work (i.e. Manual or Non- Manual) on the severity of back pain in the past six months. The data were as follow:
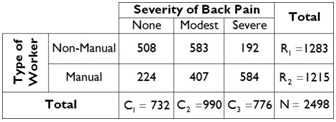
Perform a Chi-square independence test (by hand) at the 5 % level of significance to determine whether there is a relationship between the severity of back pain and the type of work in this particular industry. If so, which type of work tends to have a greater proportion of workers with severe back pain?
Make sure you state the relevant hypotheses, test statistic, p-value and a concluding statement regarding your finding.
QUESTION 4
For Q3 of Assignment 1, you would have noticed that the assumption of normality does not hold for the pollutant CO. Given this, perform the appropriate non-parametric test (by hand) and determine whether there is a difference in CO measured by the QCMD as compared to the ground truth at the 5 % level of significance. The relevant data are given in the Excel file "CO.xlsx".
Make sure you state the relevant hypotheses, test statistic, p-value and a concluding statement regarding your finding.
Attachment:- Assignment.rar