Reference no: EM131019839
Homework 4-
1. Suppose there is a perfectly competitive market that is initially in long run equilibrium. For each of the scenarios below, identify what will happen in the short run to the equilibrium price, the equilibrium quantity produced by the firm, the equilibrium quantity produced by the market, and the level of economic profits received by the firm. Then, identify what will happen in the long run to the equilibrium price, the equilibrium quantity produced by the firm, the equilibrium quantity produced by the market, and the level of economic profits received by the firm. Also, identify whether there will be entry or exit of firms in the long run. I have provided a handy summary table for you to enter your answers. Assume the perfectly competitive industries in this question are constant cost industries with respect to current technology and inputs.
Summary Table:
|
Scenario
|
A
|
B
|
C
|
D
|
|
SHORT RUN
|
|
|
|
|
|
Firm Price
|
|
|
|
|
|
Firm Quantity
|
|
|
|
|
|
Market Price
|
|
|
|
|
|
Market Quantity
|
|
|
|
|
|
Firm's economic profit
|
|
|
|
|
|
LONG RUN
|
|
|
|
|
|
Entry or Exit of Firms
|
|
|
|
|
|
Firm Price
|
|
|
|
|
|
Firm Quantity
|
|
|
|
|
|
Market Price
|
|
|
|
|
|
Market Quantity
|
|
|
|
|
|
Firm's economic profit
|
|
|
|
|
Secnarios (assume each scenario is a separate event and that in the short run, the market price is always sufficient to cover the firm's variable costs of production):
a. People decide that this product is good for their health.
b. The price of a complement good increases.
c. The price of a substitute good increases.
d. People's incomes increase and this good is an inferior good.
2. Suppose there is a constant cost perfectly competitive industry with a market demand curve that can be expressed as P = 100 - (1/10)Q where P is the market price and Q is the market quantity. Furthermore, suppose that all the firms in this industry are identical and that a representative firm's total cost can be expressed as TC = 100 + 5q + q2 where q is the quantity produced by this representative firm. The representative firm's marginal cost is MC = 5 + 2q.
a. In the long run, how many units will this firm produce and what price will it sell each unit for in this market?
b. What is the total market quantity produced in this market in the long run?
c. When the market price of the good is equal to $5, this market does not provide any units of this good. Given this information and all the other information you have either been given or calculated, write an equation for the market supply curve.
d. What is the value of FC for the representative firm in this industry?
e. At the long run profit maximizing quantity for the representative firm, what is the value of VC for the firm?
f. Compute the value of consumer surplus and producer surplus in this market. What is the value of total surplus in this market?
g. Suppose that demand in this market changes and that at every price the quantity demanded decreases by 475 units. What is the new market demand curve? Given this market demand curve, what are the new equilibrium quantity in the market and the new short run equilibrium price in this market?
h. Given the price you found in part (g), will this representative firm choose to produce in the short run?
i. For those firms that choose to produce in the short run, what will the level of short run economic profit for the firm equal?
j. In the long run what do you think will happen in this market? How many firms will be in the industry in the long run (hint: it is okay if you get a fractional firm)?
3. Suppose there is a monopoly serving a market and the market demand curve is equal to Q = 1000 - 10P. The monopolist's MC is given by the equation MC = 5 + (2/75)Q. The monopolist's TC can be found by calculating the area under the monopolist's MC curve over the relevant range of production.
a. What is the equation for the monopolist's marginal revenue curve?
b. What is the profit maximizing level of output for the monopolist? What price will the monopolist sell the product for in this market? (Hint: the numbers are ugly here, so just round to two places past the decimal and use your calculators!)
c. What is the value of TR for the monopolist? What is the value of TC for the monopolist? (Hint: remember to find the TC you will want to compute the area under the monopolist's MC curve from an output of 0 units to the profit maximizing level of output.) What is the value of economic profit for the monopolist? (Hint: these numbers will not be even, whole numbers. Here is a time when you will want to use your calculators!!)
d. Compare your answer in part (c) to your answer in problem (2) for the long run equilibrium in perfect competition. In your comparison compare the market price under perfect competition and monopoly, the market quantity under perfect competition and monopoly, and the level of long run economic profits for the industry (hint: to find this for the perfectly competitive industry you need to find the level of profits for a representative firm and then multiply this amount by the number of firms). In addition compare the value of consumer surplus, producer surplus and total surplus for the monopolist versus the perfectly competitive market. What is the value of the deadweight loss due to the monopoly? I have provided you a handy summary table for your comparison. (Hint: the numbers for the monopoly are ugly....use a calculator.)
|
|
Perfectly Competitive Industry
|
Monopoly
|
|
Market Quantity
|
|
|
|
Market Price
|
|
|
|
Economic Profit in Industry
|
|
|
|
Consumer Surplus
|
|
|
|
Producer Surplus
|
|
|
|
Total Surplus
|
|
|
|
Deadweight Loss
|
|
|
4. The following graph illustrates the market demand curve, the average total cost curve, and the marginal cost curve for a natural monopoly.
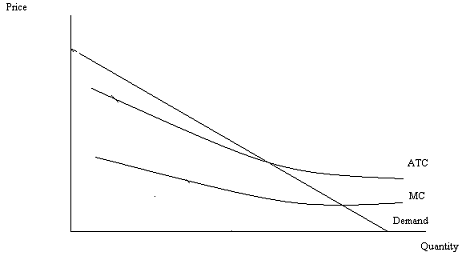
a. On the graph indicate the quantity this monopolist would produce if it was not regulated. Identify this quantity as Qm. On the graph mark the monopolist's price as Pm. In addition, label the area that corresponds to the monopolist's profits.
b. On the same graph indicate the quantity this monopolist would produce if it was regulated so that the price of each unit equaled the average cost of production. Label this quantity Qatc and the price the monopolist would charge Patc. What is the relationship between the monopolist's TR and TC when it is regulated so that for the last unit produced the price is equal to the ATC?
c. On the same graph indicate the quantity this monopolist would produce if it was regulated so that the price of each unit equaled the MC of producing the last unit. Label this quantity Qmc and the price the monopolist would charge Pmc. Label the area that corresponds to the monopolist's profits when it is regulated to produce that level of output where the MC = P for the last unit produced. Are the monopolist's profits positive or negative with this type of regulation?
d. What is the socially optimal amount of output for the natural monopoly to produce? Why is this the socially optimal amount of output?
5. Suppose there is a monopolist that sells a good in a market. Furthermore, suppose this monopolist can divide the consumers of this good into two different classes. The First Class has a market demand curve equal to P = 10 - (1/8)Q while the Second Class has a market demand curve equal to P = 20 - (1/2)Q. This monopolist has constant MC equal to $4 per unit.
a. Draw a three panel graph of this monopolist: in the first graph depict the demand for the First Class group of customers; in the second graph depict the demand for the Second Class group of customer; and in the third graph depict the market demand curve. Label your graphs carefully and thoroughly.
b. Draw the MR schedules on all three of the graphs you drew in part (a).
c. Determine the total amount of the good that will be produced in the market if this monopolist practices third degree price discrimination. Then, determine the quantity of the good the monopolist will supply to First Class customers and the quantity of the good the monopolist will supply to Second Class customers. Make sure that the sum of the amount supplied to these two different classes of customers equals the total amount of the good that the monopolist is going to produce when he profit maximizes. What price will be charged to the First Class buyers? What price will be charged to the Second Class buyers?
d. Calculate the price discriminating monopolist's TR, TC, economic profits.
e. Calculate the price discriminating monopolist's producer surplus and consumer surplus.
f. Now, imagine that this monopolist faces the same market demand, but is now constrained to act as a single price monopolist. Calculate the market quantity this monopolist will produce as well as the price of the product. Calculate the single price monopolist's TR, TC, and economic profit. Finally calculate the single price monopolist's producer surplus and consumer surplus. Record your findings in the table below so that you can compare the outcome when the monopolist practices third degree price discrimination with the outcome when the monopolist charges a single price.
|
|
Single Price Monopolist
|
Third Degree Price Discriminating Monopolist
|
|
Market Quantity Produced
|
|
|
|
Price(s) of the Good
|
|
|
|
TR
|
|
|
|
TC
|
|
|
|
Economic Profit
|
|
|
|
Consumer Surplus
|
|
|
|
Producer Surplus
|
|
|
6. The summer league tennis matches have started in Madison and competition is fierce. Team Lobsters are scheduled to play Team Top Spinners this week and the captains of both teams are trying to figure out their optimal strategy. Each team match consists of five separate matches played by a total of eight people: there are two singles matches and three doubles matches. Team Lobsters if it ranks its players from strongest to weakest knows that it will lose the #1 singles match, the #2 singles match, and the #1 doubles match. Thus, Team Lobsters will lose the overall match 2-3 if it goes with this line-up. If Team Lobsters plays its second-best singles player as #1 (i.e., it reverses the playing order of its singles players) and it moves its #3 doubles team to the #1 position it will win the match 3-2 provided that Team Top Spinners goes with its strongest line-up. If Team Top Spinners also scrambles its line-up Team Lobsters will lose 2-3. If Team Lobsters does not scramble its line-up while Team Top Spinners does Team Lobsters wins the match 3-2.
a. Both teams face two choices: "Scramble the Line-Up" or "Not Scramble the Line-Up". In the payoff matrix below fill in the payoffs in terms of the number of games won for the two teams.
b. Is there a dominant strategy for Team Lobsters given this information? Is there a dominant strategy for Team Top Spinners given this information?
c. Suppose that the payoff matrix for this game changes to the payoffs given in the table below. The matrix changes because Team Lobsters has recruited a new, stronger player (this is always a possibility in summer tennis league).
Does either team have a dominant strategy now? Can you predict the match outcome and winner given this information?