Reference no: EM132330127
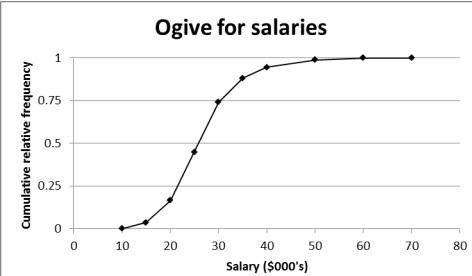
Question 1: A manufacturing company is reviewing the annual salaries of its full-time employees below the executive level at a large plant.
The following table and the graph summarize some aspects of the salary distributions.
| Salary ($1000) |
Frequency |
Frequency density |
Midpoint |
Frequency × midpoint |
| 10 to 15 |
115 |
23 |
12.5 |
1437.5 |
| 15 to 20 |
413 |
82.6 |
17.5 |
7227.5 |
| 20 to 25 |
913 |
182.6 |
22.5 |
20542.5 |
| 25 to 30 |
934 |
186.8 |
27.5 |
25685 |
| 30 to 35 |
451 |
90.2 |
32.5 |
14657.5 |
| 35 to 40 |
207 |
?? |
37.5 |
7762.5 |
| 40 to 50 |
138 |
13.8 |
45 |
6210 |
| 50 to 60 |
32 |
3.2 |
55 |
1760 |
| 60 to 70 |
4 |
0.4 |
65 |
260 |
| Total |
3207 |
|
|
85542.5 |
(a) What percentage of employees earn more than $40000 per year?
(b) What is the frequency density of salaries in the interval $35000 - $40000?
(c) Why should frequency density be used rather than frequency when graphing this distribution?
(d) Based on the grouped data supplied, and calculations provided in the table, estimate the value of the mean of the distribution.
(e) Using the ogive supplied, estimate the value of the median.
(e) By considering appropriate numerical measure, comment on the symmetry or skewness of the distribution.
Question 2: The Life's Great company has developed a new model of television, the Clarity, to the point where it is ready to be evaluated by the marketing department. Before introducing a television to the marketplace the marketing research department always conducts an extensive study and releases a report, either Favourable, neutral, or Unfavourable.
Those given an Unfavourable report are never released. An examination of past data reveals that about 30% of models have been given a favourable report, about 50% were given a neutral report and the remaining 20% were given an unfavourable report. Of those given a favourable report, 80% were successful in the marketplace. Of those given a neutral report, 50% were successful.
(a) What method can be used to estimate probabilities from this information?
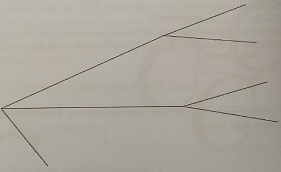
(b) By adding appropriate labels and probabilities, use the following tree diagram to summarise the probability information given above. Include labels indicating the event and probability corresponding to each branch, the event and probability corresponding to each endpoint.
Use the following notation for events:
F is the event that a model receives a favourable report; N is the event that it receives a neutral report; U is the event that it receives an unfavourable report. S is the event that a model is successful and ¯S is the event that it is unsuccessful.
(c) What is the probability that the clarity model will be successful?
(d) The previous model, the Genius was marketed but was not successful. What is the probability that the marketing department's report was favourable for that model?
Question 3: From experience a retailer has determined that the number of broken light bulbs X in a box containing 10 dozen Super brand light bulbs has the following probability distribution.
|
x
|
0
|
1
|
2
|
3
|
|
Pr(x)
|
0.80
|
0.10
|
0.05
|
0.05
|
(a) What is the probability that in a randomly selected box of Super light bulbs, there is more than one broken light bulb?
(b) What is the expected value of X?
(c) Suppose the retailer has just received 15 boxes of Super light bulbs. Let Y be the number of boxes with no broken light bulbs.
(i) What kind of probability distribution does Y have? State the values of the parameters.
(ii)To 3 decimal places, what is the probability that there are between 4 and 8 boxes (inclusive) with no broken light bulbs?
Question 4: The Malaysian Inland Revenue Department examined the refunds made by individuals filing for Income tax returns prior to March 31. They found that the average annual refund amounts to RM1236 with a standard deviation RM535. One explanation for this figure was that the taxpayers who file early usually have higher refund than the late filers. (Note: The unit of currency in Malaysia is the Ringgit, denoted by RM.)
(a) Suppose the amount owed or due on tax returns for the early filers are normally distributed. Denote the random variable "amount owed" by X.
(i) Write down an expression for the standard normal variable Z corresponding to X.
Using tables for the standard normal distribution, calculate the proportion of income tax
(ii) Calculate the percentage of income tax returns showing that the early filers owe money to the government. (Hint: If the early filers owe money to the government, the refund should be less than zero.)
(b) During an audit, the average refund for a random sample of 30 early-filed income tax returns is calculated. Denote the random variable "Average for a random sample of 30 early-filed income tax returns" by Y.
(i) What kind of distribution does Y have?
What is its mean?
What is its standard deviation?
(ii) What is the probability that this average is at least RM1700?
Question 5
The amount of time undergraduates spend weekly on part-time jobs is normally distributed. A random sample of 35 students revealed a mean of 120 minutes with a standard deviation of 25 minutes.
(a) Calculate a 95% confidence interval for the mean over the whole student body of time spent weekly on part time jobs.
(b) Is the assumption that time spent on part-time jobs is normally distributed needed here?
(c) Another student asks you: "Having calculated this confidence interval, what should I be 95% confident of?" Answer the student's question.
Question 6
The approval process for a life insurance policy requires a review of the application and the applicant's medical history, possible requests for additional medical information and medical examinations, and a policy compilation stage where the policy pages are generated then delivered. The ability to deliver approved policies to customers in a timely manner is critical to the profitability of this operation. During a period of one month, a random sample of 27 policies is selected and the total processing time in days is recorded. The sample is reproduced here:
73 19 16 64 28 28 31 90 60 56 31 56 22
18 45 48 17 17 17 91 92 63 50 51 69 16 17
The mean of this sample is 43.9 days while the standard deviation is 25.3 days.
(a) In the past, the mean processing time averaged 45 days. Sate any assumptions that you need and then perform a hypothesis test to determine whether at the 5% level of significance there is sufficient evidence to conclude that the mean processing time has changed. Use the critical value method, and state the conclusion in terms of the business problem described in the question.
By constructing a stem and leaf plot in the table provided below, determine whether the assumption needed in (a) is seriously violated. Explain briefly.
|
Stem
|
Leaves
|
|
0
|
|
|
1
|
|
|
2
|
|
|
3
|
|
|
4
|
|
|
5
|
|
|
6
|
|
|
7
|
|
|
8
|
|
|
9
|
|
Question 7
Marketing consultants working for the distributor of Primrose brand liquid laundry detergent are interested in the relationship between price and demand for the detergent. For each of 30 sales periods they have gathered data concerning demand for the product, and also the average difference (in dollars) between the price of Primrose and the price of competitors' similar detergents (price of competing brands minus price of Primrose). The results were plotted on the following graph.

(a) Based on this graph, explain what kind of model is appropriate to describe the relationship between the two variables.
(b) Which is the predictor variable and which is the response variable? Explain the reason for the choice.
(c) Excel was used to perform regression analysis on the data. The following is an extract from the regression output
|
SUMMARY OUTPUT
|
|
|
|
|
|
|
|
Regression Statistics
|
|
Multiple R
|
0.8897
|
|
|
|
|
|
|
R Square
|
0.7915
|
|
|
|
|
|
|
Adjusted R Square
|
0.7841
|
|
|
|
|
|
|
Standard Error
|
0.3166
|
|
|
|
|
|
|
Observations
|
30
|
|
|
|
|
|
|
|
Coefficients
|
Standard Error
|
t Stat
|
P-value
|
Lower 95%
|
Upper 95%
|
|
Intercept
|
7.814
|
0.080
|
97.818
|
4.851E-37
|
7.650
|
7.978
|
|
Price Difference
|
2.665
|
0.258
|
10.310
|
4.881E-11
|
2.136
|
3.195
|
(i) Based on this analysis, write down an equation for the least squares estimate for demand, ^y, in terms of price difference x.
(ii) In the box below, write down the null and alternative hypotheses for a test to determine whether there is a positive relationship between price difference and demand. Explain the meaning of all symbols used. Use the p-value method and perform the test at the 1% level of significance.
(iii) Comment on price difference as a predictor of demand.
Question 8
(a) In the discussion of time series, explain the meaning of "seasonal component", and "cyclic component".
(b) The following graph shows Malaysian hotel occupancy rates, quarterly from January 1999 to January 2006.

The data from which this graph was created is given in the following table.
|
Year
|
Quarter
|
Average occupancy
(%)
|
Moving
average
|
|
1999
|
1
|
46.4
|
|
|
|
2
|
49.3
|
|
|
|
3
|
53.9
|
52.2
|
|
|
4
|
57.4
|
53.8
|
|
2000
|
1
|
50.3
|
55.9
|
|
|
2
|
57.9
|
57.0
|
|
|
3
|
61.8
|
57.4
|
|
|
4
|
58.7
|
57.2
|
|
2001
|
1
|
52
|
56.7
|
|
|
2
|
54.7
|
57.2
|
|
|
3
|
61.3
|
57.6
|
|
|
4
|
62.7
|
57.8
|
|
2002
|
1
|
51.2
|
58.2
|
|
|
2
|
57.2
|
57.5
|
|
|
3
|
61.8
|
56.7
|
|
|
4
|
57.2
|
55.2
|
|
2003
|
1
|
49.8
|
53.2
|
|
|
2
|
46.4
|
|
|
|
3
|
57.1
|
54.0
|
|
|
4
|
59.3
|
56.3
|
|
2004
|
1
|
56.4
|
58.9
|
|
|
2
|
58.4
|
60.4
|
|
|
3
|
65.6
|
61.3
|
|
|
4
|
62.7
|
62.2
|
|
2005
|
1
|
60.7
|
63.0
|
|
|
2
|
61.5
|
63.5
|
|
|
3
|
68.6
|
63.9
|
|
|
4
|
63.7
|
|
|
2006
|
1
|
63.2
|
|
The final column is the four quarter centred moving average for the data, which is also shown on the graph.
(i) Find the four quarter centred moving average for the second quarter of 2003.
(ii) What components are evident in the original series, and which of them have been almost completely removed in calculating the moving average? Explain briefly.
(iii) The seasonal indices based on the moving average are given by:
|
Quarter
|
Seasonal
index
|
|
1
|
0.926
|
|
2
|
0.963
|
|
3
|
1.065
|
|
4
|
|
Supply the seasonal index for the fourth quarter. Show your working below.
(iii) With reference to the seasonal indices, discuss how the occupancy rates vary over the year. Be specific about the magnitude of the variation.
Question 9
In a historical study of wages in South Africa, The following data were used.
Table 5
|
Year
|
CPI (2000 = 100)
|
CPI (1995 = 100)
|
|
1990
|
42.2
|
|
|
1995
|
72.4
|
|
|
1996
|
77.7
|
|
|
1997
|
84.4
|
|
|
2000
|
100
|
|
Table 6
|
Mean hourly wage in certain industries, 1995 and 1997 Nominal rand
|
|
Agriculture
|
Transport
|
Finance
|
Domestic
|
|
1995
|
3.11
|
14.20
|
17.95
|
2.92
|
|
1997
|
3.57
|
14.37
|
18.26
|
4.1
|
(a) Complete Table 5 by supplying the CPI with 1995 = 100 for all given years. Use the box the for any working.
(b) What was the rate of inflation from 1996 to 1997? Show your working.
(c) (i) Complete Table 7 below by calculating the 1997 hourly wages in 1995 rand.
Show any working in the box below.
Table 7
Mean hourly wage in certain industries, 1995 and 1997 Real (1995) rand
Agriculture Transport Finance Domestic
1995 3.11 14.20 17.95 2.92
1997
(ii) Referring to tables 6 and 7, summarise briefly how hourly wages changed in these industries between 1995 and 1997.