Reference no: EM137687
1. There are two statistics classes. The first has 250 students and the second has 200 students. In the first class the students are instructed to toss a coin 20 times and record the value of , the proportion of heads. The instructor then makes a histogram of the 250 values of obtained. In the second class the students are instructed to toss a coin 40 times and record the value of , the proportion of heads. The instructor then makes a histogram of the 200 values of obtained. The histogram of values for the first class should be
A. more biased since it is based on a smaller number of tosses.
B. more variable since it is based on a smaller number of tosses.
C. less variable since it is based on a larger number of students.
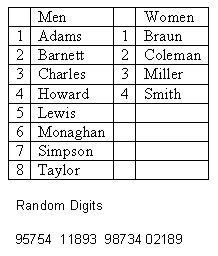
2. Twelve people who suffer from chronic fatigue syndrome volunteer to take part in an experiment to see if shark fin extract will increase one's energy level. Eight of the volunteers are men and four are women. Half of the volunteers are to be given shark fin extract twice a day and the other half a placebo twice a day. We wish to make sure that 4 men and 2 women are assigned to each of the treatments, so we decide to use a block design with the men forming one block and the women the other. The names of the men and women are given in the chart and each name is given a numerical label.
Use the list of random digits below to assign 4 men and 2 women to the shark fin treatment. Read the table from left to right, first selecting the 4 men and then the 2 women. Use the numerical labels given in the chart to the names.
The people assigned to the shark fin treatment are

A. 5, 7, 5, 4, 1, 1.
B. Lewis, Simpson, Howard, and Braun. We must give both Lewis and Braun a double dose since they are selected twice.
C. Lewis, Simpson, Howard, Adams, Braun, Miller.
3. A statistics instructor wants to know which route will get her to school the fastest. Each day from October 2 to November 15, when she gets to the turn point she checks the odometer on her car. If it shows an even number she takes the freeway; if it shows an odd number, she takes the in-town route. She records the total time each day. What is the explanatory variable in this study?
A. the route
B. the odometer reading
C. the time to school
|
Find a simple random sample of 50 freshmen
: They wish to conduct a survey of their students and find a simple random sample of 50 Freshmen, 40 Sophomores, 35 Juniors, and 30 Seniors.
|
|
Smallest standard deviation to the statistic
: Assuming the population is large, which sample size will give the smallest standard deviation to the statistic and select the numbers for the first five to be interviewed.
|
|
Example on sampling variability
: Sampling variability refers to the idea that different samples will include different individuals
|
|
Observational and sample study
: A statistics instructor wants to know which route will get her to school the fastest. Each day from October 2 to November 15, when she gets to the turn point she checks the odometer on her car
|
|
What is the explanatory variable in this study
: Use the list of random digits below to assign 4 men and 2 women to the shark fin treatment. Read the table from left to right, first selecting the 4 men and then the 2 women. Use the numerical labels given in the chart to the names.
|
|
Sampling variability
: A simple random sample of 1000 Americans found that 61% were satisfied with the service provided by the dealer from which they bought their car.
|
|
Evalauate the variance of their salaries
: A random sample of students is selected, and each one is asked to try first brand A and then brand B, or vice versa with the order determined at random.
|
|
Example on sampling distribution
: A study sponsored by American Express Co. and the French government tourist office found that old American stereotypes about French unfriendliness weren't true.
|
|
Example on stratified random sample
: Researchers are studying the absorption of two drugs into the bloodstream. Each drug is to be injected at three dosages. There are 24 people in the study, and they are randomly divided into six groups.
|