Reference no: EM132346665
Assignment -
Q1. In a sample of 6 software developers, the mean length of the work week is 60 hours, with standard deviation 5 hours.
What is the 95% confidence interval for the average work week in the software development trade?
A. [56.0, 64.0]
B. [55.4, 64.6]
C. [54.6, 63.4]
D. [54.8, 65.2]
Q2. A filling machine in a brewery is designed to fill bottles with 355 ml of hard cider. In practice, however, volumes vary slightly from bottle to bottle. The brewer suspects that the filling machine has been under filling the bottles. In a sample of 49 bottles, the mean volume of cider is found to be 354 ml, with a standard deviation of 3.5 ml. To determine if the machine is under filling bottles, the brewer performs a one-sided hypothesis test.
What is the best formulation of the null hypothesis?
A. The true mean cider volume of each bottle is 354 ml.
B. The true mean cider volume of each bottle is at least 355 ml.
C. The machine is under filling the bottles.
D. The machine is under filling the bottles by 1 ml.
Q3. In a finance class, the midterm exam's scores were distributed approximately normally, with mean 13 (out of 20), and standard deviation 4.
Approximately what proportion of the test takers scored no higher than 17?
A. 16%
B. 32%
C. 68%
D. 84%
Q4. The ages of employees at a small software development company, Crackerjack Networks, are listed below.
What is the mean age of Crackerjack employees?
A. 24
B. 25
C. 25.25
D. 24.5
|
Employee
|
Age
|
|
Bazer, Glen
|
26
|
|
Billings, Thor
|
29
|
|
Chaplain, Samuel
|
25
|
|
Daboss, Mike
|
24
|
|
Elbow, Jimmy
|
24
|
|
Hark, Joley
|
26
|
|
Kramerbauer, Natasha
|
24
|
|
Trindle, Jenny
|
24
|
Q5. A market research firm wants to find out if men and women feel differently about SilkyTouch facial tissues. In a survey of 90 men, 76% said they had a favorable impression of SilkyTouch. Out of 182 surveyed women, 64% said they had a favorable impression of SilkyTouch.
At a 95% confidence level, which conclusion should the research firm draw?
A. Overall, about 70% of the population has a favorable impression of SilkyTouch.
B. Men and women feel differently about SilkyTouch.
C. More women than men have a favorable impression of SilkyTouch.
D. There is insufficient evidence to show that men and women feel differently about SilkyTouch.
Q6. The table below displays data on the composition and performance of the Massachusetts Bubble Growth (MBG) technology stock fund over the last year. The table includes data on the distribution of stocks in the fund by technology sector (information technology [IT] or biotechnology) and by last year's "performance" (positive or negative net change in share price over the last year).
What is the probability that a randomly-chosen MBG stock is a biotech stock?
A. 30%
B. 23%
C. 7%
D. None of the above
|
Massachussets Bubble Growth Stocks
|
|
Performance\Sector
|
Biotech
|
IT
|
|
Positive
|
23%
|
17%
|
|
Negative
|
7%
|
53%
|
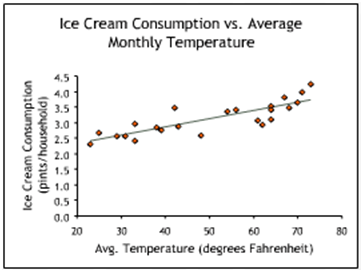
Q7. The regression analysis below characterizes the relationship between monthly ice cream consumption (in pints per household) and the independent variable "average monthly temperature" (in degrees Fahrenheit).
Which of the following statements about the term "1.797" is true?
A. It tells us the maximum amount above which ice cream consumption cannot possibly grow.
B. It tells us the minimum amount below which ice cream consumption cannot possibly fall.
C. It tells us the x-intercept of the regression equation.
D. It tells us the y-intercept of the regression equation.
|
Ice Cream Consumption vs. Average Monthly Temperature
|
|
Regression Statistics
|
|
|
|
Multiple R
|
0.8409
|
|
|
R2
|
0.7071
|
|
|
Adjusted R2
|
0.6932
|
|
F test result
|
|
Standard Error
|
0.2891
|
|
F value
|
Signif. F
|
|
Observation
|
23
|
|
50.70
|
0.0000
|
|
|
Coefficients
|
Std Error
|
t Stat
|
P-value
|
|
Intercept
|
1.797
|
0.197
|
9.108
|
0.0000
|
|
Avg. Monthly Temp.
|
0.027
|
0.004
|
7.121
|
0.0000
|
Q8. The regression analysis below characterizes the relationship between the current month's ice cream consumption (in pints per household) and the independent variables "current month's average temperature" (in degrees Fahrenheit), "previous month's average temperature" (in degrees Fahrenheit), and "average price" (in dollars per pint).
What will be the variable "previous month's temperature" in this analysis?
A. A lagged variable
B. A dependent variable
C. Not statistically significant at the 0.05 level
D. All of the above
|
Ice Cream Consumption vs. Current Month's Avg. Temperature Previous Month's Avg. temperature, and Avg. Price
|
|
Regression Statistics
|
|
|
|
Multiple R
|
0.9222
|
|
|
R2
|
0.8505
|
|
|
Adjusted R2
|
0.8256
|
|
F test result
|
|
Standard Error
|
0.2208
|
|
F value
|
Signif. F
|
|
Observation
|
22
|
|
34.14
|
0.0000
|
|
|
Coefficients
|
Std Error
|
t Stat
|
P-value
|
|
Intercept
|
0.040
|
1.870
|
0.021
|
0.9833
|
|
Current Month's Avg. Temp.
|
0.040
|
0.005
|
7.543
|
0.0000
|
|
Previous Month's Avg. Temp.
|
-0.016
|
0.006
|
-2.854
|
0.0105
|
|
Average Price
|
0.444
|
0.445
|
0.999
|
0.3312
|
9. The ages of employees at a small software development company, Crackerjack Networks, are listed below.
In the event that Natasha Kramerbauer leaves the company to enter an MBA program, what is the median age of the remaining seven employees?
A. 24
B. 25
C. 25.25
D. 24.5
|
Employee
|
Age
|
|
Bazer, Glen
|
26
|
|
Billings, Thor
|
29
|
|
Chaplain, Samuel
|
25
|
|
Daboss, Mike
|
24
|
|
Elbow, Jimmy
|
24
|
|
Hark, Joley
|
26
|
|
Kramerbauer, Natasha
|
24
|
|
Trindle, Jenny
|
24
|
Q10. The regression analysis below characterizes the relationship between monthly ice cream consumption (in pints per household) and the independent variable "average monthly temperature" (in degrees Fahrenheit).
Which of the following would be a reasonably accurate prediction?
A. If the average monthly temperature is 48 degrees, average per household ice cream consumption will be around 3.1 pints.
B. If average monthly temperature is 48 degrees, average per household ice cream consumption will be around 2.6 pints.
C. If average monthly temperature is 48 degrees, average per household ice cream consumption will be around 86.3 pints.
D. If average monthly temperature is 48 degrees, average per household ice cream consumption will be around 1.3 pints.
|
Ice Cream Consumption vs. Average Monthly Temperature
|
|
Regression Statistics
|
|
|
|
Multiple R
|
0.8409
|
|
|
R2
|
0.7071
|
|
|
Adjusted R2
|
0.6932
|
|
F test result
|
|
Standard Error
|
0.2891
|
|
F value
|
Signif. F
|
|
Observation
|
23
|
|
50.70
|
0.0000
|
|
|
Coefficients
|
Std Error
|
t Stat
|
P-value
|
|
Intercept
|
1.797
|
0.197
|
9.108
|
0.0000
|
|
Avg. Monthly Temp.
|
0.027
|
0.004
|
7.121
|
0.0000
|
Q11. The regression analysis below characterizes the relationship between monthly ice cream consumption (in pints per household) and the independent variable "average monthly temperature" (in degrees Fahrenheit).
At what level of significance is the relationship between ice cream consumption and temperature statistically significant?
A. 0.05
B. 0.01
C. 0.001
D. All of the above
|
Ice Cream Consumption vs. Average Monthly Temperature
|
|
Regression Statistics
|
|
|
|
Multiple R
|
0.8409
|
|
|
R2
|
0.7071
|
|
|
Adjusted R2
|
0.6932
|
|
F test result
|
|
Standard Error
|
0.2891
|
|
F value
|
Signif. F
|
|
Observation
|
23
|
|
50.70
|
0.0000
|
|
|
Coefficients
|
Std Error
|
t Stat
|
P-value
|
|
Intercept
|
1.797
|
0.197
|
9.108
|
0.0000
|
|
Avg. Monthly Temp.
|
0.027
|
0.004
|
7.121
|
0.0000
|
12. The scatter diagram and regression line below characterize the relationship between monthly ice cream consumption (in pints per household) and the independent variable "average monthly temperature" (in degrees Fahrenheit).
The residual errors are defined as
A. The vertical distances from the data points to the horizontal axis.
B. The horizontal distances from the data points to the vertical axis.
C. The vertical distances from the data points to the regression line.
D. The shortest distance from the data points to the regression line.
Q13. In a move to improve relations with employees, the human resource manager of a company with multiple departments (marketing, information technology, accounting, etc.) wants to send surveys out to 50 employees. The surveys contain questions about employees' job satisfaction.
In order to get the most representative responses, to whom should the manager send the surveys?
A. To 50 employees in a randomly selected department
B. To 50 employees selected by an election to represent the workforce
C. To 50 employees selected randomly by drawing their names from a pool of all employees
D. To the 50 most recent hires
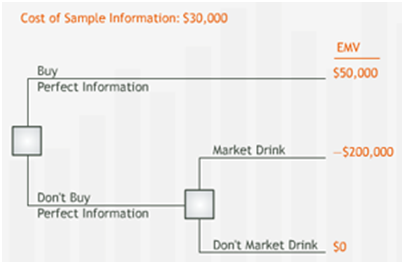
Q14. The manager of the Regal Beverage Company (RBC) must decide whether or not to market a new soft drink flavor. The new drink's success depends heavily on consumer reaction to it. An initial decision analysis based on available data reveals that the expected monetary value of marketing the new drink is -$200,000. The EMV of buying perfect information for this decision is $50,000, as shown in the tree below. A market research firm offers to do market research for RBC at a cost of $30,000. Although not perfect, the market research should give RBC some information about potential customer reaction to the new flavor.
Based on an EMV analysis, what should the RBC's manager do?
A. Buy the research firm's sample information.
B. Market the new drink instead of buying the research firm's sample information.
C. Neither buy the research firm's sample information nor market the new drink.
D. The answer cannot be determined from the information provided.
Q15. When an additional independent variable is added to a regression analysis, which of the following could be indications of multicollinear independent variables?
A. A drop in R-squared and a drop in significance for one or more independent variable
B. A drop in adjusted R-squared and an increase in significance for one or more independent variable
C. An increase in adjusted R-squared and an increase in significance for one or more independent variable
D. An increase in adjusted R-squared and a drop in significance for one or more independent variable
Q16. A campaign strategist wants to determine whether demographic shifts have caused a drop in allegiance to the Uniformian Party in Bowie County. Historically, around 62% of the county's registered voters have supported the Uniformians. In a survey of 196 registered voters, 57% indicated that they would vote for the Uniformians in the next election.
Assuming a confidence level of 95% and conducting a one-sided hypothesis test, which of the following should the strategist do?
A. Accept the hypothesis that the proportion of Uniformian voters has not changed.
B. Accept the hypothesis that the proportion of Uniformian voters has decreased.
C. Conclude that the proportion of Uniformian voters is now between 56% and 62%.
D. There is not enough evidence to support the hypothesis that the proportion of Uniformian voters has decreased.
Q17. The regression analysis below characterizes the relationship between monthly ice cream consumption (in pints per household) and the independent variable "average monthly temperature" (in degrees Fahrenheit).
Based on this analysis, which of the following statements is correct?
A. For every increase of 0.027 degrees in average monthly temperature, average ice cream consumption increases by 1 pint.
B. For every increase of 1 degree in average monthly temperature, average ice cream consumption increases by 0.027 pints.
C. For every increase of 1.797 degrees in average monthly temperature, average ice cream consumption increases by 1 pint.
D. For every increase of 1 degree in average monthly temperature, average ice cream consumption increases by 1.797 pints.
|
Ice Cream Consumption vs. Average Monthly Temperature
|
|
Regression Statistics
|
|
|
|
Multiple R
|
0.8409
|
|
|
R2
|
0.7071
|
|
|
Adjusted R2
|
0.6932
|
|
F test result
|
|
Standard Error
|
0.2891
|
|
F value
|
Signif. F
|
|
Observation
|
23
|
|
50.70
|
0.0000
|
|
|
Coefficients
|
Std Error
|
t Stat
|
P-value
|
|
Intercept
|
1.797
|
0.197
|
9.108
|
0.0000
|
|
Avg. Monthly Temp.
|
0.027
|
0.004
|
7.121
|
0.0000
|
Q18. The regression analysis below characterizes the relationship between monthly ice cream consumption (in pints per household) and the independent variables "average monthly temperature" (in degrees Fahrenheit) and "average price" (in dollars per pint).
What does the coefficient of 0.027 for average monthly temperature inform us about?
A. The relationship between temperature and ice cream consumption when not controlling for price (i.e. allowing price to range freely).
B. The relationship between temperature and ice cream consumption when controlling for price (i.e. fixing price).
C. The relationship between temperature and ice cream price when controlling for consumption (i.e. fixing consumption).
D. The relationship between temperature and ice cream price when not controlling for consumption (i.e. allowing consumption to range freely).
|
Ice Cream Consumption vs. Average Monthly Temperature and Average Price
|
|
Regression Statistics
|
|
|
|
Multiple R
|
0.8476
|
|
|
R2
|
0.7183
|
|
|
Adjusted R2
|
0.6902
|
|
F test result
|
|
Standard Error
|
0.2905
|
|
F value
|
Signif. F
|
|
Observation
|
23
|
|
25.50
|
0.0000
|
|
|
Coefficients
|
Std Error
|
t Stat
|
P-value
|
|
Intercept
|
-0.262
|
2.315
|
-0.113
|
0.9112
|
|
Avg. Monthly Temp.
|
0.027
|
0.004
|
7.070
|
0.0000
|
|
Average price
|
0.496
|
0.556
|
0.893
|
0.3826
|
Q19. The correlation coefficient of two variables is -1. What does this mean?
A. There is no linear relationship between the two variables.
B. There is a perfect linear relationship between the two variables.
C. The two variables are statistically independent.
D. There is a strong nonlinear relationship between the two variables.
Q20. The regression analysis below characterizes the relationship between monthly ice cream consumption (in pints per household) and the independent variables "average monthly temperature" (in degrees Fahrenheit) and "average price" (in dollars per pint).
At a significance level of 0.05, which independent variables contribute significantly to the consumption of ice cream?
A. Average monthly temperature only
B. Average price of a pint of ice cream only
C. Both independent variables
D. Neither independent variable
|
Ice Cream Consumption vs. Average Monthly Temperature and Average Price
|
|
Regression Statistics
|
|
|
|
Multiple R
|
0.8476
|
|
|
R2
|
0.7183
|
|
|
Adjusted R2
|
0.6902
|
|
F test result
|
|
Standard Error
|
0.2905
|
|
F value
|
Signif. F
|
|
Observation
|
23
|
|
25.50
|
0.0000
|
|
|
Coefficients
|
Std Error
|
t Stat
|
P-value
|
|
Intercept
|
-0.262
|
2.315
|
-0.113
|
0.9112
|
|
Avg. Monthly Temp.
|
0.027
|
0.004
|
7.070
|
0.0000
|
|
Average price
|
0.496
|
0.556
|
0.893
|
0.3826
|
Q21. Which of the following statements is not true about the standard deviation?
A. It is used to measure the variability of a data set.
B. It is the square of the variance.
C. It is the square root of the variance.
D. It is measured in the same units as the units of the data.
Q22. After a series of major corporations admitted to large accounting irregularities, a public policy research institute conducts a survey to determine whether the public favors increased governmental regulation and oversight of corporations.
Which of the following questions will deliver an unbiased response?
A. In light of the recent wave of shocking corporate accounting fraud, should government increase its regulation and oversight of corporations?
B. Should privately-owned companies be subjected to intrusive governmental regulation and oversight?
C. Is the government doing enough to protect American shareholders from corporate greed?
D. None of the above
Q23. A manufacturer of guitar amplifiers markets one of its models, Vagabond, at a power rating of 45 watts. GuitarGod magazine suspects that this rating is inaccurate for this year's model of the amp. In a random sample of 32 units of this year's version of the Vagabond the mean output power is 42 watts, with a standard deviation of 8 watts.
Assuming a confidence level of 95%, which of the following statements do these data support?
A. This year's Vagabond's output power is 45 watts.
B. This year's Vagabond's output power is 42 watts.
C. This year's Vagabond's output power is not 45.
D. None of the above
Q24. When calculating a confidence interval for a mean, which of the following measures will reduce the width of the confidence interval?
A. Increasing the confidence level
B. Decreasing the sample size
C. Increasing the sample size
D. None of the above
Q25. Stock 1's closing price over the last month has a mean of 31.2 and a standard deviation of 1.9. Stock 2's closing price over the last month has a mean of 59.2 and a standard deviation of 3.3.
Which has the higher coefficient of variation?
A. Stock 1
B. Stock 2
C. The coefficients of variation are the same
D. The answer cannot be determined from the data provided
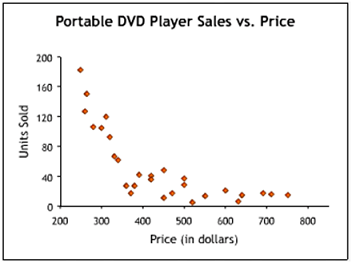
Q26. The scatter diagram below plots last week's sales and prices of 28 models of portable DVD players at a consumer electronics retailer.
Which of the following best characterizes the relationship between units sold and price?
A. Negative and linear
B. Positive and linear
C. Positive and nonlinear
D. Negative and nonlinear
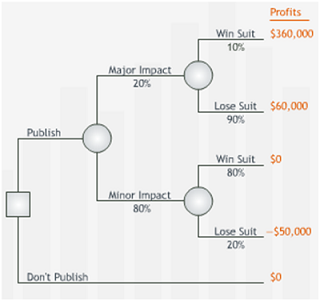
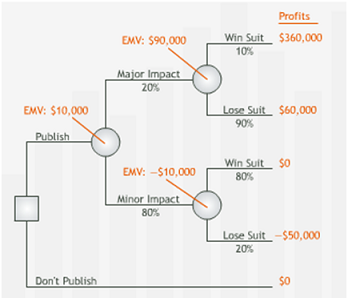
Q27. Jaune Magazine (JM) must decide whether or not to publish a tell-all story about a celebrity. If the story ends up having major impact, JM will realize substantial profits from additional magazine sales, subscriptions, and advertising revenues. However, if JM publishes the story, JM will face a lawsuit; if it loses the suit, the penalties could be substantial. The tree below summarizes JM's decision.
What is the expected monetary value of publishing the story?
A. $10,000
B. -$10,000
C. $26,000
D. $90,000
Q28. Which of the following is not true about the Normal Distribution?
A. It is completely described by its mean and its standard deviation.
B. Its median is equal to its mode.
C. Its median is equal to its mean.
D. The range of possible outcomes is finite.
Q29. GMAT scores are reported to be distributed normally, with a mean of around 520.
Approximately, where will ninety-five percent of all test-takers' scores fall?
A. Within 1 standard deviation of the mean
B. Within 2 standard deviations of the mean
C. Within 3 standard deviations of the mean
D. Above the mean
Q30. The table below displays data on the composition and performance of the Massachusetts Bubble Growth (MBG) technology stock fund over the last year. The table includes data on the distribution of stocks in the fund by technology sector (information technology [IT] or biotechnology) and by last year's "performance" (positive or negative net change in share price over the last year).
Regarding the stocks that made up the MBG fund last year, which of the following statements is true?
A. Technology sector and performance are statistically independent.
B. The fact that a given stock's performance was positive tells us nothing about its sector.
C. The fact that a given stock is from the biotech sector tells us nothing about its performance.
D. None of the above
|
Massachussets Bubble Growth Stocks
|
|
Performance\Sector
|
Biotech
|
IT
|
|
Positive
|
23%
|
17%
|
|
Negative
|
7%
|
53%
|
Q31. A market researcher plans to sample sales receipts at a natural food store to estimate the average size (in dollars) of a customer purchase. Previous analysis suggests that the standard deviation of the purchase amount is approximately $25.
In order to calculate a 95% confidence interval of total width less than $5, how many sales records should the researcher include in her sample?
A. 97
B. 271
C. 385
D. The answer cannot be determined from the information provided.
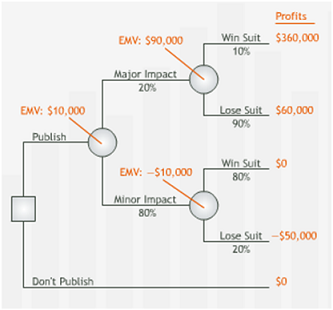
Q32. Jaune Magazine (JM) must decide whether or not to publish a tell-all story about a celebrity. If the story ends up having major impact, JM will realize substantial profits from additional magazine sales, subscriptions, and advertising revenues. However, if JM publishes the story, JM will face a lawsuit; if it loses the suit, the penalties could be substantial. The tree below summarizes JM's decision.
If JM publishes the story, the publisher may feel remorse for having violated the celebrity's privacy. For what values of the cost of remorse would not publishing the story be preferable to publishing the story on the basis of EMV?
A. Higher than $10,000
B. Lower than $10,000
C. Lower than $12,500
D. None of the above
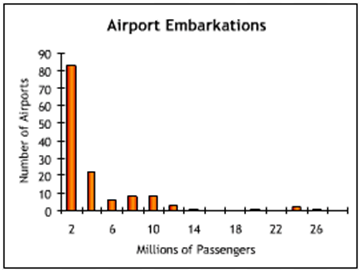
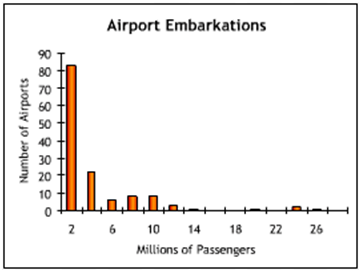
Q33. The histogram below graphically represents the distribution of the number of passengers embarking at the 135 busiest airports in the United States in 1990.
Which of the following statements can be inferred from this histogram?
A. The mean number of passengers embarking per airport is greater than the median number of passengers embarking per airport.
B. The median number of passengers embarking per airport is greater than the mean number of passengers embarking per airport.
C. The mean and median numbers of passengers embarking per airport are equal.
D. The relative sizes of the mean and median numbers of passengers embarking per airport cannot be inferred from the histogram.
Q34 Jaune Magazine (JM) must decide whether or not to publish a tell-all story about a celebrity. If the story ends up having major impact, JM will realize substantial profits from additional magazine sales, subscriptions, and advertising revenues. However, if JM publishes the story, JM will face a lawsuit; if it loses the suit, the penalties could be substantial. The tree below summarizes JM's decision.
The EMV of publishing the story is $10,000. Based on this EMV, JM should publish the story. If the publisher chooses not to publish the story, which of the following best describes the publisher's attitude towards this decision?
A. Risk averse
B. Risk neutral
C. Risk seeking
D. Risqué
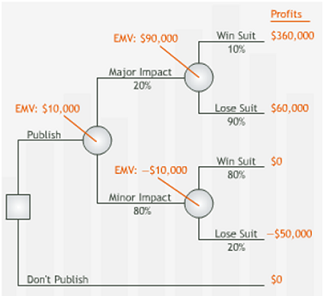
Q35. Jaune Magazine (JM) must decide whether or not to publish a tell-all story about a celebrity. If the story ends up having major impact, JM will realize substantial profits from additional magazine sales, subscriptions, and advertising revenues. However, if JM publishes the story, JM will face a lawsuit; if it loses the suit, the penalties could be substantial. The tree below summarizes JM's decision.
The EMV of publishing the story is $10,000. Based on this EMV, JM should publish the story. For what values of p = Prob[story has major impact] is publishing the story preferable to not publishing the story on the basis of EMV?
A. p < 10%
B. p > 10%
C. p < 90%
D. None of the above
Q36. The histogram below graphically represents the distribution of the number of passengers embarking from the 135 busiest airports in the United States in 1990.
This distribution is _____.
A. uniform
B. symmetric
C. bimodal
D. skewed right
Q37. In a regression analysis, which of the following cannot happen when a new independent variable is added?
A. R-squared increases and adjusted R-squared increases.
B. R-squared increases and adjusted R-squared decreases.
C. R-squared decreases and adjusted R-squared decreases.
D. Any of the above can occur when a new independent variable is added.
Q38. The table below displays data on the composition and performance of the Massachusetts Bubble Growth (MBG) technology stock fund over the last year. The table includes data on the distribution of stocks in the fund by technology sector (information technology [IT] or biotechnology) and by last year's "performance" (positive or negative net change in share price over the last year).
What is the conditional probability that an MBG stock had a positive change in share price, given that it is an IT stock?
A. 24.3%
B. 42.5%
C. 40.0%
D. None of the above
|
Massachussets Bubble Growth Stocks
|
|
Performance\Sector
|
Biotech
|
IT
|
|
Positive
|
23%
|
17%
|
|
Negative
|
7%
|
53%
|
Q39. The Kingston Review (KR) is testing a new GMAT question. The KR wants to determine what proportion of test-takers will answer the question correctly, in order to assess its difficulty. In a random sample of 144 test-takers, 75% answered the question correctly.
What is the 95% confidence interval for the proportion of test-takers answering the question correctly?
A. [65.7%, 84.3%]
B. [67.9%, 82.1%]
C. [69.1%, 80.9%]
D. The answer cannot be determined from the information provided.
Q40. The regression analysis below characterizes the relationship between monthly ice cream consumption (in pints per household) and the independent variable "average monthly temperature" (in degrees Fahrenheit). The Multiple R value 0.8409 tells us the correlation between the dependent and independent variables. The R-squared value is 71%.
Based on these measures, which of the following statements is correct?
A. The variation in average monthly temperature explains about 71% of the variation in household ice cream consumption.
B. The variation in average monthly temperature explains about 84% of the variation in household ice cream consumption.
C. Predictions about future household ice cream sales will be correct within a 71% confidence interval.
D. Predictions about future household ice cream sales will be correct within an 84% confidence interval.
|
Ice Cream Consumption vs. Average Monthly Temperature
|
|
Regression Statistics
|
|
|
|
Multiple R
|
0.8409
|
|
|
R2
|
0.7071
|
|
|
Adjusted R2
|
0.6932
|
|
F test result
|
|
Standard Error
|
0.2891
|
|
F value
|
Signif. F
|
|
Observation
|
23
|
|
50.70
|
0.0000
|
|
|
Coefficients
|
Std Error
|
t Stat
|
P-value
|
|
Intercept
|
1.797
|
0.197
|
9.108
|
0.0000
|
|
Avg. Monthly Temp.
|
0.027
|
0.004
|
7.121
|
0.0000
|
Q41. A nutrition researcher wants to determine the mean fat content of hen's eggs. She collects a sample of 40 eggs. She calculates a mean fat content of 23 grams, with a sample standard deviation of 8 grams.
What is the 95% confidence interval for this sample?
A. [22.6 grams; 23.4 grams]
B. [7.0 grams; 39.0 grams]
C. [20.5 grams; 25.5 grams]
D. [19.7 grams; 26.3 grams]
Q42. The regression analysis at the bottom characterizes the relationship between the daily number of visitors at an amusement park and the variable "school day." "School day" is an independent variable that is equal to 1 when a given day is a school day and equal to 0 when it is not.
What does the coefficient of -13,644 tell us?
A. On average, the number of visitors on school days is 13,644 lower than on non-school days.
B. On every school day, the number of visitors is exactly 13,644 lower than on non-school days.
C. On average, the number of visitors on school days is 13,644.
D. On average, the number of visitors on non-school days is 13,644.
|
Daily Amusement Park Visitors s. School Day
|
|
Regression Statistics
|
|
|
|
Multiple R
|
0.9593
|
|
|
R2
|
0.9203
|
|
|
Adjusted R2
|
0.9177
|
|
F test result
|
|
Standard Error
|
2048
|
|
F value
|
Signif. F
|
|
Observation
|
33
|
|
357.81
|
0.0000
|
|
|
Coefficients
|
Std Error
|
t Stat
|
P-value
|
|
Intercept
|
20,970
|
547.31
|
38.31
|
0.0000
|
|
School Day
|
-13,644
|
721.30
|
-18.92
|
0.0000
|
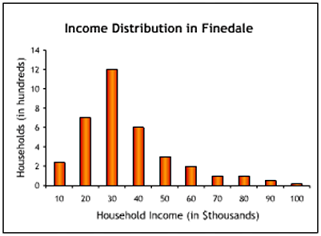
Q43. The histogram below shows the income distribution pattern of households in the small town of Finedale. Each month, to approximate the average income in the town, the local newspaper surveys 50 randomly-selected households and averages their reported incomes. The survey has been repeated once a month for 3 years.
If the distribution of the average incomes from the 36 samples is graphed, the distribution will be
A. skewed strongly to the left.
B. skewed strongly to the right.
C. approximately normal.
D. bimodal.