Reference no: EM131373303
Interpreting Statistics Worksheet
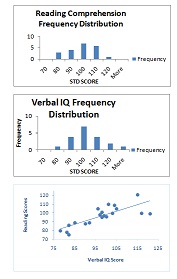
Testing of 20 randomly selected subjects yielded two sets of scores: Verbal IQ and Reading Comprehension. The table below displays the results and descriptive statistics, as well as frequency distribution charts for each variable and a scatterplot of the correlations between the two variables:
|
Subject
|
Verbal IQ
|
Rdg.Comp.
|
|
1
|
90
|
88
|
|
2
|
99
|
97
|
|
3
|
101
|
110
|
|
4
|
115
|
121
|
|
5
|
97
|
98
|
|
6
|
98
|
95
|
|
7
|
92
|
89
|
|
8
|
104
|
109
|
|
9
|
103
|
100
|
|
10
|
117
|
100
|
|
11
|
100
|
96
|
|
12
|
98
|
101
|
|
13
|
96
|
105
|
|
14
|
105
|
105
|
|
15
|
78
|
80
|
|
16
|
121
|
99
|
|
17
|
82
|
75
|
|
18
|
85
|
89
|
|
19
|
81
|
78
|
|
20
|
82
|
86
|
|
MEAN
|
97
|
96
|
|
MEDIAN
|
98
|
97
|
|
MODE
|
98
|
89
|
|
STD.DEV.
|
11.8
|
11.2
|
|
RANGE
|
43
|
46
|
|
CORREL VERB x RDG
|
0.79
|

Please answer the following questions within the appropriate column in the table below:
I. Using the provided data and graphs, describe thefrequency distributionfor the IQ test:
a) What is a typical score for this sample?
b) How variable are the scores?
c) How are the scores distributed?
II. Using the provided data and graphs, describe thefrequency distribution of the reading test scores:
a) What is a typical score for this sample?
b) How variable are the scores?
c) How are the scores distributed?
III. Consider the correlation datagiven the provided data and graph:
a) How are IQ and reading achievement related?
IV.Evaluate the data from a psychological testing perspective:
a) Are these samples good representations of the general population?How do you know?
b) What could you do to make them a more representative sample?
c) How would you interpret the correlation results?
d) What are some ways this knowledge of their relationship could be used?
|
Why i am still not a christian as defined by given course
: If you profess to be "saved", then you will witness to 1 unbeliever and write a paper detailing the account.- Write a paper expounding on the topic "Why I am still not a Christian as defined by this course."
|
|
Discuss about the case given below
: Violet was a student in human services. She enrolled in school as a single mom with three children, ages 3, 12, and 15. Violet had served in the military for three years and was receiving funding from the Armed Services. She still struggled to pro..
|
|
Discuss what role does depression play in suicide
: Research some of the common risk factors for suicide in our society. Discuss what role does depression play in suicide in regards to one's age, gender, ethnecity, and socioeconomic status
|
|
Owner of a desktop publishing firm experienced
: The owner of a desktop publishing firm has experienced a 10% drop in her net worth over the last 3 years. If her current net worth is $225,000, what was her net worth 3 years ago?
|
|
What is a typical score for this sample
: Testing of 20 randomly selected subjects yielded two sets of scores: Verbal IQ and Reading Comprehension. The table below displays the results and descriptive statistics, as well as frequency distribution charts for each variable and a scatterplot..
|
|
Calculate the average power consumed
: A refrigerator has to transfer an average of 263 J of Heat per second from -10°C to 25°C.Calculate the average power consumed. Assume that the refrigerator is ideal
|
|
What was the original cost
: The tuition charged for each credit hour is increased by 5% of itself. If the new cost of a credit hour is $84, what was the original cost?
|
|
How trade deficits or surpluses can influence growth of gdp
: How trade deficits or surpluses can influence the growth of productivity and GDP. Analyze how monetary policy could influence the long-run behavior of price levels, inflation rates, costs, and other real or nominal variables.
|
|
Purpose of the impairment test
: Write a report to management, specifically explaining the purpose of the impairment test - how the existence of goodwill will affect the impairment test
|