Reference no: EM131086966
Econ 310, Spring 2014- Week 2:
Question 1: Calculate the mean, median, mode, and variance of the following students grades:
|
Table: Data Categories
|
|
Student
|
Grade
|
|
Tom
|
80
|
|
Sean
|
90
|
|
Ed
|
60
|
|
Ben
|
70
|
|
Nate
|
80
|
How do you interpret the standard deviation? Here's a "Rule of Thumb", dubbed the "Empirical Rule": If the histogram of the data is approximately bell-shaped, then:
i. Approximately 68% of all observations fall within 1 standard devation of the mean.
ii. Approximately 95% of all observations fall within 2 standard devation of the mean.
iii. Approximately 99.7% of all observations fall within 3 standard devation of the mean.
But, more generally, Chebysheff's Theorem says: the fraction of observations in any sample or population that lie within k standard deviations of the mean is at least:
1 - 1/k2 for k > 1
Another way of measuring variation is through percentiles. For example, the 25th percentile of data (first quartile) is where 25% of the data is below a value and 75% of the data is above. The interquartile range is the difference between the third quartile and the first quartile.
Question 2: Calculate the variance of the following grade data. How much data falls within 1 standard deviation of the data? Does it correspond with the empirical rule? Does it correspond with Chebysheff's Theorem? What is the interquartile range?
|
Table 3: Data Categories
|
|
Student
|
Grade
|
Did you eat ice cream before the exam?
|
|
1
|
1
|
0
|
|
2
|
2
|
0
|
|
3
|
2
|
1
|
|
4
|
3
|
1
|
|
5
|
3
|
1
|
|
6
|
3
|
0
|
|
7
|
4
|
0
|
|
8
|
4
|
1
|
|
9
|
5
|
1
|
|
10
|
6
|
0
|
Question 3: Correlations. From the above data, calculate the covariance and correlation between grade and ice cream consumption. Can you infer anything? What does the correlation number mean?
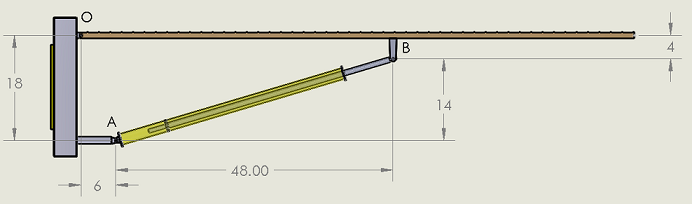
Question 4: Interpret this figure plot
|
Describe the behavioral and physical effects of nicotine
: Review the neural basis of the reinforcing effects and withdrawal effects of opiates. Describe the behavioral and physical effects of cocaine and amphetamine. Describe the behavioral and physical effects of nicotine.
|
|
History of a management style
: b. In your work experience or the work experience of someone you know, how has the role of a supervisor versus a manager changed over the years? c. What necessitated the changes - for both management styles and supervisor roles? d. Give an example ..
|
|
Find the gain margin and phase margin
: Is this system stable? Find the gain margin and phase margin.
|
|
Question regarding the foreign exchange market
: Identify and explain three ways in which a floating currency can be managed by its monetary authorities when intervening in the foreign exchange market?
|
|
What does the correlation number mean
: Correlations. From the above data, calculate the covariance and correlation between grade and ice cream consumption. Can you infer anything? What does the correlation number mean
|
|
Capstan autos operated an east coast dealership
: Capstan Autos operated an East Coast dealership for a major Japanese car manufacturer. Capstan's owner, Sidney Capstan, attributed much of the business's success to its no-frills policy of competitive pricing and immediate cash payment.
|
|
How many degrees of phase lag does this system have
: How many degrees of phase lag does this system have under these conditions?
|
|
How much did she pay in interest
: Diane Van Os decided to buy a new car since her credit union was offering such low interest rates. She borrowed $31,100 at 5.5% on December 28 2012, and paid it off February 23 2014. How much did she pay in interest?
|
|
How will you avoid using fallacious reasoning in your essay
: As you are working on your outline this week, review your three subtopics. Do you see any fallacies in them? How will you avoid using fallacious reasoning in your essay?
|