Reference no: EM13763963
Question 1
1. The following graph shows a firm with a kinked demand curve.
a. What assumption lies behind the shape of this demand curve?
b. Identify the firm's profit-maximizing output and price.
c. Use the graph to explain why the firm's price is likely to remain the same, even if marginal costs change.
Graph is attached as photo
Question 2
3. Some games of strategy are cooperative. One example is deciding which side of the road to drive on. It doesn't matter which side it is, as long as everyone chooses the same side. Otherwise, everyone may get hurt.
Driver 2
LEFT RIGHT
Driver 1 Left 0,0 -1000, - 1000
Right -1000, - 1000 0,0
a. Does either player have a dominant strategy?
b. Is there a Nash equilibrium in this game? Explain.
c. Why is this called a cooperative game?
Question 3
A monopolist has a constant marginal and average cost of $10 and faces a demand curve ofQD = 1000 - 10P. Marginal revenue is given by MR = 100 - 1/5Q.
a. Calculate the monopolist's profit-maximizing quantity, price, and profit.
b. Now suppose that the monopolist fears entry, but thinks that other firms could produce theproduct at a cost of $15 per unit (constant marginal and average cost) and that many firmscould potentially enter. How could the monopolist attempt to deter entry, and what would themonopolist's quantity and profit be now?
c. Should the monopolist try to deter entry by setting a limit price?
Question 4
Suppose a firm has a constant marginal cost of $10. The current price of the product is $25, and at that price, it is estimated that the price elasticity of demand is -3.0.
a. Is the firm charging the optimal price for the product? Demonstrate how you know.
b. Should the price be changed? If so, how?
Question 5
A monopolist sells in two geographically dividedmarkets, the East and the West. Marginal cost isconstant at $50 in both markets. Demand and marginalrevenue in each market are as follows:
QE = 900 - 2PE
MRE = 450 - QE
QW = 700 - PW
MRW = 700 - 2QW
a. Find the profit-maximizing price and quantity in each market.
b. In which market is demand more elastic?
Follow these instructions for completing the assignment:
- Place all answers, both numerical and written, in a single excel spreadsheet.
- Place each problem into a separate tab or sheet in an Excel file.
- Place labels on spreadsheet inputs and outputs, and use the yellow highlighter on the top menu bar to highlight your final answer.
- If the question incorporates graphs, you must replicate the graph on your spreadsheet file.
- Do not submit Word files or multiple files for a single assignment
Doing regression analysis on Excel is a two-step process. Complete the following:
1. Install the Analysis Tool-Pak on your PC.
2. Run the regression analysis.
The Analysis Tool-Pak is an Excel add-in. The Analysis Tool-Pak is part of Excel, but is not installed in the typical initial installation.
The directions on this handout are based on Excel 2007. If you have a different version of Excel, the steps below will be the same, but their location on the menu may be somewhat different. Consult the "Help" function for specifics about your version of Excel.
- To install the Analysis Tool-Pak on your PC:
- Click on the "Office" button (the yellow circle on the upper left corner of the screen), then click the "Excel Options" button at the bottom.
- Click "Add-Ins" on the left panel.
- Select "Excel Add-Ins" from the dropdown list at the bottom.Then click "Go."
- Select the "Analysis Tool-Pak" check box in the "Add-Ins" dialog box, and then click "OK."
- If an alert appears that asks if you want to install the Add-In, click yes.
- Enter your data and run the regression analysis.
- Enter the data to be used for your problem.Data must be entered by columns, with the independent variables (x-variables) in adjacent columns.
- The dependent variable can be entered in ether the left or right column of your spreadsheet.For purposes of running the example in this handout, enter the data below as shown.
|
Sample Problem for Regression Handout
|
|
y
|
xl
|
x2
|
|
2
|
3
|
7
|
|
4
|
4
|
11
|
|
6
|
6
|
13
|
|
8
|
8
|
19
|
|
10
|
9
|
23
|
- Click on "Data" (top menu bar), then "Data Analysis," then "Regression," and then "OK."
- Place the cursor in the "Input Y Range" box. Highlight the range of cellson the spreadsheet that contain the y-variable.
- Place the cursor in the "Input X Range" box. Highlight the range of cells on the spreadsheet that contain the x-variables. (Recall that they should be entered in adjacent rows or columns.)
- Click on the "Output Range" button. Place the cursor in a blank cell on the spreadsheet where no spreadsheet content currently appears (either below or to the right of the cell). (Cell A10 should work for this example.) Click on that cell, and the cell address will appear in the box next to Output Range. This cell represents the upper-left corner of the location where your regression output will appear.
- Click "OK" on the regression dialog box. The regression output will appear. You may need to widen the column widths on your spreadsheet to get the entire variable label to appear.
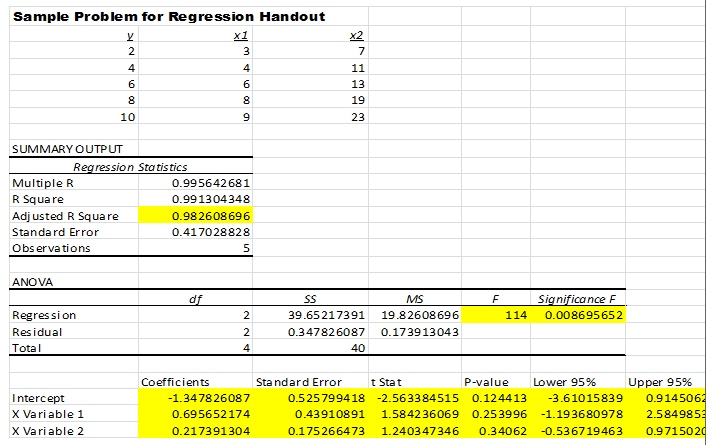
- To help you locate important results, the following are highlighted in yellow.(These are discussed in the textbook.)They are not highlighted in the default output of Excel.
- Intercept and variable coefficients
- Standard error of the intercept and of each coefficient
- T-statistic of the intercept and of each coefficient
- The probability of obtaining a t-statistic of this value, given that the null hypothesis (the intercept or variable coefficient) is zero.(The null hypothesis holds.)
- The 95% confidence interval for the variable coefficient and the intercept.
- The adjusted R-square value
- The F-statistic and its significance