Reference no: EM13371462
Use the table below for Questions 1-4.
|
Cust ID
|
Order ID
|
Shipping Cost
|
Delivery Method
|
Delivery Time (hrs)
|
Customer Satisfaction
|
|
A1
|
G13
|
$295.00
|
Ground
|
66
|
3
|
|
A2
|
D5
|
$488.00
|
Air
|
962
|
5
|
|
A3
|
H7
|
$471.00
|
Air
|
533
|
3
|
|
A4
|
L2
|
$986.00
|
Ground
|
833
|
3
|
|
A5
|
N87
|
$834.00
|
Air
|
917
|
1
|
|
A6
|
O16
|
$962.00
|
Ground
|
327
|
1
|
|
A7
|
G45
|
$639.00
|
Ground
|
758
|
1
|
|
A8
|
N89
|
$954.00
|
Ground
|
494
|
3
|
|
A9
|
Z77
|
$884.00
|
Ground
|
139
|
2
|
|
A10
|
R38
|
$346.00
|
Ground
|
495
|
4
|
|
A11
|
C30
|
$436.00
|
Air
|
476
|
4
|
|
A12
|
W07
|
$332.00
|
Air
|
782
|
2
|
|
A13
|
E21
|
$252.00
|
Air
|
495
|
5
|
|
A14
|
K87
|
$405.00
|
Air
|
471
|
2
|
1) How many categories in the ACME transportation table are qualitative?
A. None
B. 2
C. 4
D. 5
2) Which categories are nominal data?
A. Cust ID, Order ID, Shipping cost, Customer Satisfaction, Delivery Method
B. Cust ID, Order ID, Delivery Method
C. Cust ID, Order ID, Customer Satisfaction, Delivery Time
D. Order ID, Customer Satisfaction
3) This data was probably collected through
A. Experiment
B. Direct observation
C. Survey
D. Both A and B
E. Both B and C
4) What type of data is customer satisfaction?
A. Nominal
B. Ordinal
C. Interval
D. Ratio
5) If you are given that the class width is 37.2, which of the following would provide the most reasonable set of upper and lower limits for a proposed frequency distribution?
A. 0 to 30; 31to 60; 61 to 90; 91 to 120
B. 0 to 39; 40 to 79; 80 to 119; 120 to 159
C. 0 to 37; 38 to 74; 74 to 111; 112 to 148
D. None of the above
In the file embedded on page 2, use the Worksheet Q6-9 to answer Questions 6 - 9. It reports the number of cases of paper delivered weekly from ACME Delivery Company.
6) Using the 2k > n how many classes would be needed for a frequency distribution of number of cases of paper from ACME Delivery Company?
A. 4
B. 5
C. 6
D. 7
7) Construct a frequency distribution using the ACME paper delivery data with 5 classes and the first class boundary extends from 0 to less than 30. What is the cumulative frequency of the frequency distribution where there are less than 120 cases?
A. .46
B. .56
C. .82
D. .92
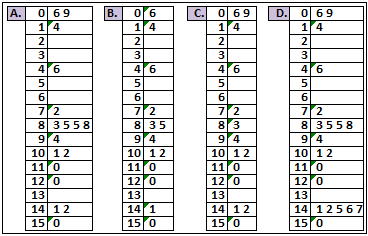
8) Which stem and leaf plot depicts the data?
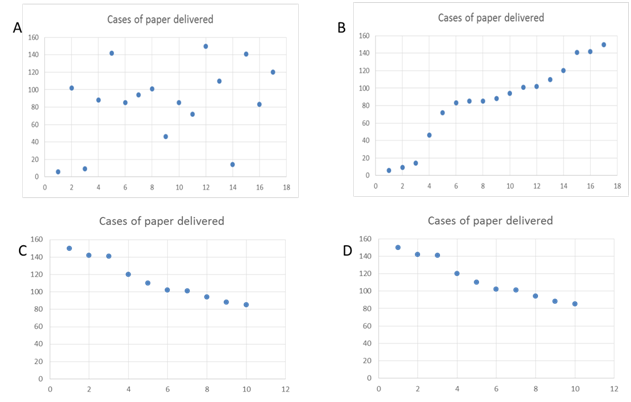
9) Which scatter plot depicts the data?
In the file embedded on page 2, use the Worksheet Q10 to answer Question 10. It reports sales and number of orders for various locations in four regions.
10) Which region has the greatest total sales (hint: contingency table)
A. East
B. West
C. North
D. South
Use the following data to answer questions 11-15:
This is a sample taken from orders placed by retailers for a new silicon spatula set, and blender bottlein the past month.Each silicon spatula set sells for $7 to retailers and blender bottle for $9.
|
Orders for silicon spatula set
|
|
Orders for blender bottle
|
|
76
|
96
|
94
|
81
|
|
100
|
21
|
52
|
73
|
|
62
|
49
|
49
|
89
|
|
21
|
72
|
49
|
26
|
|
61
|
36
|
38
|
81
|
|
61
|
55
|
97
|
92
|
|
51
|
44
|
79
|
82
|
|
40
|
89
|
41
|
64
|
|
72
|
99
|
28
|
77
|
|
34
|
74
|
22
|
100
|
|
40
|
66
|
79
|
49
|
|
78
|
98
|
85
|
23
|
|
68
|
33
|
88
|
61
|
|
48
|
78
|
74
|
34
|
11) What is the average number of merchandise per order, for all orders? Round to the nearest integer.
A. 58
B. 60
C. 63
D. 65
12) What is the range of orders regardless of the type of merchandise ordered?
A. 64
B. 79
C. 83
D. 100
13) What is the standard deviation of all orders in this sample?
A. 14.93
B. 21.39
C. 22.43
D. 23.83
14) What is the weighted average price of each merchandise unit sold last month? Round to two decimals.
A. $7.49
B. $7.96
C. $8.05
D. $8.11
15) What is Coefficient of Variation for silicon spatula set orders?
A. 0.3176
B. 0.3319
C. 0.3422
D. 0.4321
Use the following data for answering questions 16-17:
This is a list of 20 stores and their last year's total apparel's sales. This data is a sample taken from a large database holding sales data for a large number of retail outlets.
|
Store #
|
Sales
|
Store #
|
Sales
|
Store #
|
Sales
|
Store #
|
Sales
|
|
1
|
$ 158,976
|
6
|
$ 872,127
|
11
|
$ 385,814
|
16
|
$ 1,778,700
|
|
2
|
$ 660,756
|
7
|
$ 197,340
|
12
|
$ 1,651,970
|
17
|
$ 72,018
|
|
3
|
$ 440,218
|
8
|
$ 32,952
|
13
|
$ 232,911
|
18
|
$ 720,489
|
|
4
|
$ 388,332
|
9
|
$ 127,920
|
14
|
$ 391,248
|
19
|
$ 156,302
|
|
5
|
$ 209,554
|
10
|
$ 117,438
|
15
|
$ 329,522
|
20
|
$ 10,983
|
16) What is the interquartile range of sales? Use the manual method discussed in your textbook.
A. 346,146
B. 367,287
C. 394,212
D. 408,376
17) What is the Z score for store #10 sales?
A. -0.6697
B. -0.6498
C. 0.6849
D. 0.4823
18) Use Chebyshev's Theorem to determine at least what percentage of sales are within 1.5 standard deviations above and below the mean.
A. 55.6%
B. 65.7%
C. 73.2%
D. 75.8%
Use the following data to answer questions 19 and 20:
This data shows the number of employees at a manufacturing facility, grouped by their years of experience in industry.
|
Years of experience
|
Number of employees
|
|
0 to under 5
|
15
|
|
5 to under 10
|
43
|
|
10 to under 15
|
39
|
|
15 to under 20
|
25
|
|
20 to under 25
|
18
|
|
25 to 30
|
9
|
19) What is the approximate average experience of employees? Round off to nearest integer.
A. 11 years
B. 12 years
C. 13 years
D. 14 years
20) What is the approximate standard deviation of employee experience in industry?
A. 6.0243
B. 6.8479
C. 6.8710
D. 7.0195
21) In the first full day of the NCAA basketball tournament 16 games are played. What is the probability of selecting every game correctly (i.e., picking the eight winning teams) for the first full day of the tournament?
A. 0.5
B. 0.00008
C. 0.0075
D. 0.8
22) How many different ways could the 32 cars in a NASCAR race finish 1st, 2nd, 3rd, 4th and 5th?
A. 24165120
B. 201376
C. 4960
D. 863040
Use the following data to answer questions 23 - 24.
The table below shows relative frequency for type of pizza sold daily at a Crusty Pizza restaurant.
|
Pizza type
|
Relative Freq.
|
|
Pepperoni
|
35.3%
|
|
Canadian Bacon
|
17.6%
|
|
Cheese
|
8.8%
|
|
Deluxe
|
26.5%
|
|
Hawaiian
|
7.3%
|
|
Vegetarian
|
?
|
23) What is the probability of selling vegetarian pizza?
A. 12.8%
B. 85.5%
C. 4.5%
D. Cannot determine
24) What is the probability of selling Hawaiian or Deluxe pizza?
A. 7.3%
B. 26.5%
C. 0%
D. 33.8%
Use the following data to answer questions 25 to 28.
The following data shows monthly profit vs. store size for Crusty Pizza stores.
|
Monthly Profit $
|
|
Store Size
|
<$-10,000
|
$-10,000 to $0
|
$0 to
$10,000
|
$10,000 to
$20,000
|
$20,000 to $30,000
|
$30,000 to $40,000
|
|
S
|
1
|
2
|
4
|
3
|
|
|
|
M
|
|
7
|
8
|
3
|
1
|
|
|
L
|
|
2
|
3
|
7
|
3
|
|
|
VL
|
|
|
2
|
9
|
3
|
2
|
25) What is the probability that a store has monthly profit of $10,000 to $20,000 and is a Large (L) store?
A. 0.12
B. 0.37
C. 0.25
D. 7
26) If a randomly selected store is classified as Medium (M) what is the probability that it's profit is $0 to $10,000?
A. 0.25
B. 0.13
C. 0.47
D. 0.42
27) Which of the following statements best describe the relationship between Very Large stores and profit of $20,000 to $30,000?
A. They are mutually exclusive
B. They are independent
C. They are neither independent nor mutually exclusive
D. They are independent but not mutually exclusive
28) What is the probability of a store being Small (S) or having a monthly profit of $-10,000 to $0?
A. 0.28
B. 0.32
C. 0.45
D. 0.17
29) How many possible outcomes are in an experiment in which 4 coins are flipped and 3 six sided dice are rolled?
A. 7
B. 12
C. 3456
D. 10368
30) Super distance Golf Ball company uses five different production lines to produce golf balls. The quality of production on the various lines is not the same. 98% of the balls from line A meet standards, 97% from line B meet standards, 99% from line C meet standards, 96% from line D and 92% from line E. The lines are run at different rates. Last week, line A produced 30%, line B produced 20%, line C produced 10%, line D produced 35% and line E produced 5% of the balls that were shipped. The golf pro at Heavenly Greens Country Club, your best customer, just called complaining that the Club's President just opened a package that contained a defective golf ball. What is the probability the defective ball came from line E?
A. 0.03
B. 0.05
C. 0.004
D. 0.13
Use the following data for problems 31 to 32
Paradise Real-estate developer is considering building a condominium project. Five different sizes are being considered. The probabilities reflect the company's belief that the profit will be realized (e.g., there is a 20% chance that a $4.2 million profit will result if the 30 unit condominium is built).
|
Condominium size
|
Probability
|
Net Profit (Millions $)
|
|
10 units
|
0.1
|
2.1
|
|
20 units
|
0.3
|
3.5
|
|
30 units
|
0.2
|
4.2
|
|
40 units
|
0.05
|
4.4
|
|
50 units
|
0.35
|
5.9
|
31) What is the expected profit?
A. $4.2 million
B. $4.385 million
C. $4.020 million
D. $3.385 million
32) What is the standard deviation for expected profit?
A. 1.2519
B. 1.5673
C. 2.4564
D. 1.4321
33) Which of the following are correct regarding discrete probability distributions
A. The summation of the probabilities for the simple events in the distribution must sum to 1.0
B. It is possible to a negative values for the probabilities
C. All probabilities must be less than or equal to one
D. Answers A, B and C are correct
E. Answers A and C are correct
34) Line A at Super distance Golf Ball company produced 3,125 golf balls last week. 98% of the balls produced onLine A meet standards. The company typically takes a sample of 50 balls each week to check quality. In the sample, what is the expected number of defective balls produced?
A. 2
B. 62.5
C. 49
D. 1
35) 25 airline travelers arrive at the security line in the airport every 15 minutes. What is the standard deviation for the number of travelers arriving in 15 minutes?
A. 25
B. 15
C. 5
D. 3.87
Use the following information to answer Questions 36 and 37.
36) The HR department at a bank performs drug testing on job applicants. The probability that someone tests positive is 0.03. In March, 50 individuals applied.Use Excel. Assume binomial. What is the probability that at least 5 of them will test positive for drug use?
A. 0.983
B. 0.013
C. 0.017
D. 0.996
37) What is the probability that none of the 50 applicants tests positive for drug use?
A. 0.218
B. 0
C. 0.178
D. 0.970
Use the following information to answer Questions 38 - 40.
In a fabric production facility, defectsoccur at an average rate of 4 per 100 yards of fabric.
38) What is the probability that the next 100 yards of fabric will have exactly no defects?
A. 0.250
B. 0.236
C. 0.045
D. 0.018
39) What is the probability that the next 100 yards will have 4 or more defects?
A. 0.500
B. 0.195
C. 0.567
D. 0.371
40) What is the probability that the next 300 yards of fabric will have exactly 6 defects?
A. 0.025
B. 0.167
C. 0.001
D. 0.312
To answer Questions 41-44, use the information below and the Worksheet Q41-44 in the file embedded on page 2.
It reports sample data for 16 months of demand for cakes ordered by customers.Jane Candy takes orders from her friends and neighbors to bake cakes for their special occasions. A quick comparison of mean and median suggests they are equal. So, she assumes demand is normally distributed.
- Use Excel to compute mean and standard deviation.
- Round off standard deviation to one-decimal.
41) What is the probability that monthly demand for cakes will exceed 100?
A. -0.221
B. 0.588
C. 0.221
D. 0.412
42) What is the probability that monthly demand for cakes will be between 30 to 80 cakes?
A. 0.50
B. 0.327
C. 0.607
D. 0.933
43) What is the probability that demand will be less than 150?
A. 0.926
B. 1.00
C. 0.874
D. 0.074
44) Jane Candy's in-laws are coming to stay with them for the whole month of April. She wants to spend the whole time with her family while they visit. Therefore, she has decided to bake cakes and freeze them to use during the month to fill demand. She can simply defrost and decorate as she receives orders. At the same time, she wants to keep her customers happy; so she has decided to bake/store enough cakes to have a 95% chance of filling total demand for cakes in April. Help Jane decide how many cakes to bake. Round up to nearest integer.
A. 112
B. 138
C. 158
D. 175
Use the following information to answer Questions 45 - 47.
The average time between breakdowns of a machine on a shop floor is 60 hours, and follows an exponential distribution.
45) What is the probability that the next breakdown will occur in the next 30 hours?
A. 0.50
B. 0.393
C. 0.149
D. 0.828
46) What is the probability that the next breakdown will occur between the next 40 to 60 hours?
A. 0.333
B. 0.854
C. 0.447
D. 0.146
47) What is the probability that the next breakdown will occur in more than 75 hours?
A. 0.996
B. 0.153
C. 0.287
D. 0.644
Use the following information to answer Questions 48 - 50.
It takes between 3 minutes to 13 minutes to fill an order at a fast-food restaurant, and that time is uniformly distributed.
48) What is the probability that it will take exactly 5 minutes to fill an order?
A. 0
B. 0.2
C. 0.5
D. 0.8
49) What is the probability that it takes between 2 to 8 minutes to fill an order?
A. 0.2
B. 0.8
C. 0.5
D. 0.6
50) What is the probability that it takes between 9 to 15 minutes to fill an order?
A. 0.4
B. 0.5
C. 0.6
D. 0.7
Download:- ACME transportation table.xlsx