This assignment requires a considerable amount of computer

Assignment Help Applied Statistics
Reference no: EM13374753

This assignment requires a considerable amount of computer work and written comment. You may need to seek guidance from your tutor along the way. Do not leave things until too late. Each question carefully describes what you are required to do, so please follow these carefully.

In this assignment, you will examine data from afruit and vegetable market that supplies fresh produce to supermarket outlets in NSW and Victoria. The market is conducting an evaluation in Sydney and Melbourne.The fruit and vegetable market wants toexamine the Price per kilogram (Price$/kg) at each of the outlets and is particularly interested in the relationship between Price$/kgand the type of produce; the season; and,quantity (sold per day).

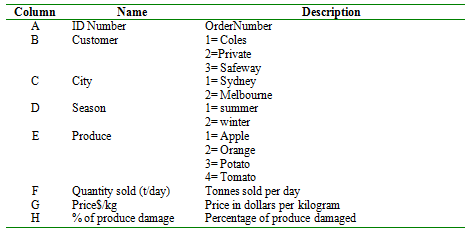
The data collected is contained in a file called 'Market.xls' and the columns of the file contain the following information:
1555_Prepare a contingency table.png

You will need to generate a random sample of 200 customers. Your answers to the assignment tasks below are to be based on your sample of 200 customers. Make sure you keep a safe copy of your sample, since you cannot use Random Sample Generator to reproduce the first sample. (If necessary, talk to your tutor about generating a new sample.)

Assignment Tasks

For each task below, you must submit all of the required printouts, graphs, tables and summaries required.

NB:Each graph and table should have a heading and each axis should have a label!!

1. Introduction and Variable List:Give a brief introduction to your report, setting out the nature of the data.

2. Data: Provide a printout of the data in your sample, sorted in ascending order based onorder (ID)number.

3. Pivot Table: Prepare a contingency table (cross-classification) using the Pivot Table option in Excel that compares types ofproduceandseason. You may use counts or percentages as the basis of comparison. Compare any similarities or differences in the types ofproduce sold, betweensummer and winter.

4. Pivot Table:Prepare another contingency table that shows the average (mean) price$/kgand average (mean) Quantity sold (t/day), classified byseasonand the type ofproduce. Compare any similarities or differences between theseasons with regard to prices, and quantity ofapples and oranges sold:

a)  Which seasonhas the highestaverage (mean) price$/kgfor oranges, and which for apples?

b) Which season has the highest mean Quantity sold (t/day)for oranges, and which for apples?          

5. T-Test:The market wants to investigate if the price$/kgof oranges in winter is less thanthe mean summer price for oranges. The current data will be used as a typical representation of the price$/kg.

a) Determine the mean, standard deviation and standard error for the price$/kgin winter of oranges in your sample.           

b) The market has found that, on average, the price of oranges in summer is $5.50/kg. Based on this information carry out a t-test to see if the average price$/kgin winter is less than the summer price of $5.50. Mention any assumptions, include relevant hypotheses and report the result and conclusion in the conventional manner.                       

6. Obtain a scatterplot of the Price$/kg and Quantity sold (t/day). Think carefully about which variable should go on the vertical axis. Remember, it is the independent variable that goes on the horizontal axis (i.e. the x-axis).  Make sure you label your axes properly and that your graph has an appropriate title.

7. Briefly describe the nature of the relationship between these two variables:Price$/kg and Quantity sold (t/day).(Hint: mention strength and direction).

8. Use Excel to carry out a regression analysison two variables: Price$/kg(independent variable) and Quantity sold (t/day)(dependent variable).

a) Copy the output into your assignment and then use it to determine the answer to the following questions.

b) Write down the regression equation.

c) State the R-squared value and the standard error and explain what they mean with respect to the data.

d) Write down the value of the gradient of the regression line and explain what it means in the context of this question.

e) Are the values for the constant and intercept (slope coefficient) significant in this case? Justify your answer using values from the output.

f) Do you think this regression model is a good model? Justify your answer using the regression output.

9. Using the information obtained for your analyses write a short conclusion about what you found out about the relationship between the Quantity sold (t/day)and price$/kg, and how this relates to seasonand the type of produce.

Download:- Market.xls

Reference no: EM13374753

Questions Cloud

Dan and cheryl are married file a joint return and have no : dan and cheryl are married file a joint return and have no children. dan age 45 is a pharmaceutial salesman and
How would you describe the discoveries of benjamin franklin : how would you describe the discoveries of benjamin franklin robert millikan cgarles-augastin de coulomb and ernest
I want to know how to draw bending moment diagram for this : i want to know how to draw bending moment diagram for this shape and the value of the moment in critical sections
You work for mit consulting a leading it project consulting : you work for mit consulting a leading it project consulting company. your expertise is in project management scoping a
This assignment requires a considerable amount of computer : this assignment requires a considerable amount of computer work and written comment. you may need to seek guidance from
Mining and metallurgy assignment metallurgyyou need to : mining and metallurgy assignment metallurgyyou need to assess the viability of an ore classification algorithm to be
Topics to cover in your written reportbull lan bull wan : topics to cover in your written reportbull lan bull wan bull leased circuits private business circuits rented from a
The distribution of knowledge that you detailed in your : the distribution of knowledge that you detailed in your initial posting. this concept tells us that the solutions to
Over half of the nations lettuce comes from three : over half of the nations lettuce comes from three california areas the imperial valley in the southeastern corner of

Reviews

Write a Review

Applied Statistics Questions & Answers

  Calculate the sensitivity of the test

Find the 96th percentile of the distribution of reaction time (at least approximately). That is, find the value such that about 96% of the distribution is below this point - Find the probability the reaction time is 500 or less.

  State the hypothesis - calculate your statistic and p-value

How do small companies compare to the major competitor and Has satisfaction with the manufacturer changed since the change in company ownership?

  1 following are positions taken by twelve senators on a

1. following are positions taken by twelve senators on a half dozen key issues. the issues are scaled from 1 to 5 with

  What is the importance of the decision theory

Decision Trees are graphic displays of the decision process. When do you feel it is appropriate to use decision trees?

  What was the sample size and how was the data collected

What was the sample size and how was the data collected? State the meaning of the confidence interval in terms of the specific question or poll.

  Regression analysis techniques

Regression analysis techniques

  The average improvement in time for the population

Let variable X represents the improvement in time for each assembly line worker. Let μ represents the average improvement in time for the population. Has the training improved the time required on the job? Please test the hypothesis use α=0.05 ..

  Construct a frequency distribution and percents

Frequency distribution from part a: Find the mean, variance and stand excldeviation and using the frequency distribution from parta: What is the probability of a randomly selected herb to have a height of at least 17 inches?

  1 ifnbspphi-z0 nbspalpha2 z0 assume alpha lt012 a company

1. ifnbspphi-z0 nbspalpha2 z0 ? assume alpha lt0.1.2. a company produces cooling tubes. the pressure of the tube is an

  Question 1a marine biologist has evidence from other

question 1a marine biologist has evidence from other studies that the number of fish is declining in certain lakes

  What is the procedure for using mean and median

What are its mean and median and what is the procedure for using mean and median to determine whether the data is skewed, and if so, in what direction?

  Find the probability that exactly 15 babies are female

Find the probability that - exactly two of the workers have been exposed to asbestos - Find the probability that exactly 15 babies are female.

Free Assignment Quote

Assured A++ Grade

Get guaranteed satisfaction & time on delivery in every assignment order you paid with us! We ensure premium quality solution document along with free turntin report!

All rights reserved! Copyrights ©2019-2020 ExpertsMind IT Educational Pvt Ltd