The multiple linear regression model analysisto begin open

Assignment Help Microeconomics
Reference no: EM13375336

The Multiple Linear Regression Model: Analysis

To begin, open the Gretl, go to file > open data > sample file, then open the data set under the "Ramanathan" tab labeled: "data 4-5 Women's labor force participation".

We will be conducting analysis on the determinants of the percentage of a state's labor force (16 years of age or older) who are female (hence, there are 50 observations for the 50 states in the U.S.). The determinants (i.e. the explanatory variables) are variables describing characteristics of the overall and the female population in the state with the expectation that at least some of these characteristics may explain the variation in female labor force participation witnessed across the 50 states in whatever year this data was collected. 

So, wlfp will be our dependent variable and the remaining variables will be our explanatory variables in our full, unrestricted model.

a) First, you need to fully understand what we are modeling. So, write out the general, unrestricted, linear function which we will be estimating using OLS (the PRF). Below this, list the variables as they are labeled in the data and beside each variable label, in a complete sentence, describe each variable fully, paying attention to the units of the variables (Note: keep in mind that when we view the summary statistics of the percentage variables we can tell that any variable that is described as a "percent" are coded in terms of full percentage values, not decimals). 

b) Estimate the linear model described in part (a) using Ordinary Least Squares regression and display your regression results. Briefly, mention which estimated coefficients are statistically significant (different than zero) and at what level of significance (i.e., 1%, 5%, or 10%) (You do not need to implement a t test for each one). Also, report the Adjusted R-squared and interpret its meaning. 

c) Interpret, fully, the estimated marginal effect (regression coefficient) of educ. Then, at the 5% level of significance, test the hypothesis that a five percent increase in the percent of the state population with a high school degree will increase women's labor force participation by more than one percent.

d) Interpret, fully, the estimated marginal effect (regression coefficient) of the unemployment rate on female labor force participation. Then, at the 5% level of significance, test the hypothesis that for every ½ of a percent increase in the unemployment rate a state's female labor force participation rate will decrease by 0.25%.

e) Use the reported F(8,41) statistic to test for the overall significance of our model at the 5% level of significance. Be sure to state the null and alternative hypotheses, the critical value, and your conclusion.

f) Test whether excluding variables for the female marriage and divorce rates will significantly decrease the explanatory power of our model at the 10% level of significance. (Hint: pages 116 - 117 of your textbook).

g) Using our full, unrestricted model, test whether the marginal effect (regression coefficient) of the percent of the state's population living in an urban area and the marginal effect (regression coefficient) of the percent of the state's population whose race is reported as white are equal. 

Our hypothesis can be stated in the following manner,

926_Multiple Linear Regression Model.png

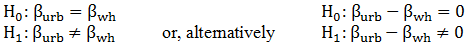
There are two ways to test such a constraint, the t-test is one; I'll help you get started:

389_Multiple Linear Regression Model1.png

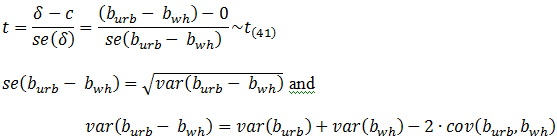
After estimating a model in Gretl you may view the variance-covariance matrix of the coefficients by clicking Analysis > Coefficient covariance matrix on the regression output screen. Each "cell" of this table is the covariance between the regression coefficients for the variables in the corresponding row and column of the table.

h) Finally, report the predicted female labor force participation rate in an average state.

Reference no: EM13375336

Questions Cloud

In the aftermath of a hurricane an entrepreneur took a : in the aftermath of a hurricane an entrepreneur took a one-month leave of absence without pay from her 4000 per month
1 truefalseuncertain read the statements carefully decide : 1. truefalseuncertain. read the statements carefully. decide whether the statement is true false or uncertain. explain
Financial crises such as the recent lsquosub-prime credit : financial crises such as the recent lsquosub-prime credit crisis have significant disruptive effects on the flow of
Nancy buys a house in 2000 he obtains a fixed 10 mortgage : nancy buys a house in 2000. he obtains a fixed 10 mortgage interest rate and makes payments of 1000 per month. the 2000
The multiple linear regression model analysisto begin open : the multiple linear regression model analysisto begin open the gretl go to file gt open data gt sample file then open
Trace the evolution of work on the laissez-faire doctrine : trace the evolution of work on the laissez-faire doctrine through two arcs. first those theorists who are trying to
Naeyc observation assignmentthis observation assignment : naeyc observation assignmentthis observation assignment will involve observing in a childcare classroom to complete a
Why do points on a utility possibility curve represent : why do points on a utility possibility curve represent efficient allocations of resources? why must the utility
Q1 cally uses labour l and capital k in her production : q1. cally uses labour l and capital k in her production process. the wage rate for one unit of labour is 10 while units

Reviews

Write a Review

Microeconomics Questions & Answers

  Determine the initial equilibrium wage and labor utilization

Assume a market is characterized by a unionized and a non unionized sector. Both sections initially have supply given through Q=10,000+25w, and demand by Q=20,000-10w, where w is weekly salary.

  What is total variable cost

What is total variable cost when 100 units of output are produced and what is average fixed cost when 150 units of output are produced?

  To improve the performance of the company

The employees of Abs "R" Us, which includes 12 fitness parlors in and around the metro area, feel they can improve the performance of the company.

  Discuss how you would take present value into account

Discuss how payment systems have evolved over time to reduce transactions costs and predict how technological advancements will continue to reduce transaction costs in the future. Provide specific examples to support your response.

  Define interest rate risk-federal funds market

why Banks are exposed to interest rate risk primarily. what does the Federal funds market involves.

  Phases of production-law of diminishing returns

Assume each worker is paid $10 per hour and works a 40-hours week. How many workers should the firm hire if the price of the output is $ 10? Suppose the price of the output falls to $7.50.What do you think would be the short-run impact on the firm..

  The underlying trend of growth in the economy

The underlying trend of growth in the economy is determined by the growth in the number of workers, the growth in the savings and investment rate.

  South korea

South Korea is one of the major beef importing countries. With no international trade, Korea's equilibrium price for beef was $10 million per kilo tonne and equilibrium quantity was 30 kilo tonne.

  Research the current interest rate on savings accounts

Your company, EconCo, has just been hired by a foreign company that is trying to open a new manufacturing plant in the United States. Because of the overload in work by the staff,

  Question on production curve

The questions asked that suppose that, because of important technological improvements, the society in question can double its production of tractors at each level of food production.

  Determine the long-run marginal cost function

Determine the long-run marginal cost function for electricity generation and determine the short-run average variable cost and marginal cost at the output level in Part (d)

  Estimated demand function for one-month memberships

Interpret the estimated demand function for one-month memberships and calculate the point price elasticity of demand and point income elasticity of demand in Town D at the price charged last year.

Free Assignment Quote

Assured A++ Grade

Get guaranteed satisfaction & time on delivery in every assignment order you paid with us! We ensure premium quality solution document along with free turntin report!

All rights reserved! Copyrights ©2019-2020 ExpertsMind IT Educational Pvt Ltd