Reference no: EM131077238
Experiment #1: Passive Filters
Objective:
After performing this experiment, you will be able to:
1. Compare the characteristics and response of a low-pass, high-pass, band-pass, and notch filters.
2. Construct a T filter, a Pi filter and a resonant filter and measure their frequency responses.
Materials Required:
Inductor: 100 mH - 1 Piece.
Resistors: 680 ?, 1.6 k? - 1 piece each.
Capacitors: 0.1 µ F - 2 Pieces, 0.033 µ F - 1 piece.
Summary of theory:
In many circuits, different frequencies are present which are encountered during the operation. Some frequencies are desired while some others are not. The non desired frequencies can be rejected with special circuits called filters. Filters can be designed to pass low or high frequencies. For example, in communication circuits, an audio frequency (AF) signal may be present with a radio frequency (RF) signal. A low-pass filter can be used to retain the AF and reject the RF signal, while a high-pass filter would do vice-versa.
Sometimes we go in for a specific band of frequency which is present between non desired ranges. A resonant circuit can be used to select the desired frequency from the band of frequencies present. A circuit that passes only selected frequency form a band is called band pass filter. The opposite of a band-pass is a band-reject or a notch filter. Various filters and their typical operation characteristics are given in following Fig 6-1-1.
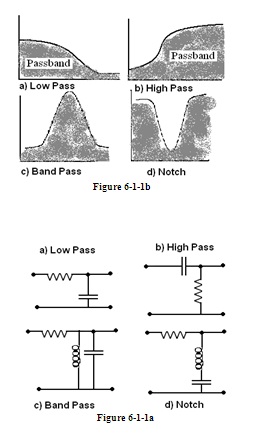
The simplest of filters would be RC and RL circuits, they can be either used as high pass or low pass filters, depending on where the input and output voltages are applied and removed. Improved filter characteristics can be obtained by combining several filter sections. Unfortunately, you cannot stack identical sections together to improve as there are loading effects that must be taken into account. The two common and popular filters are T and Pi filters. They get their name from the placement of components in their circuits. It is notable that low pass filters have inductors in series with the load and capacitors in parallel with load. The high-pass filter is the opposite.
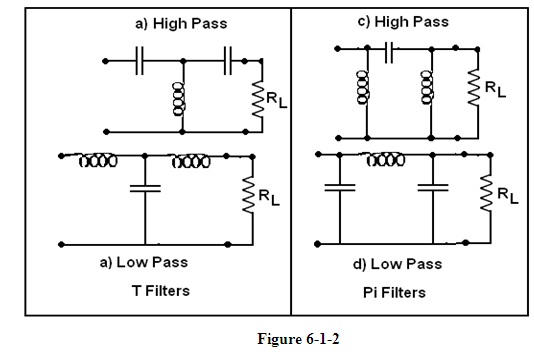
Generally the choice of using a T or Pi filter is determined by the load resistor and source impedance. If the load resistor is much larger than the source impedance, then the T-type filter is the best. If the load resistor is much lower than the source impedance we go in for Pi filter.
Procedure:
- Obtain all the components listed in Table 6-1-1. Measure the listed components and record their measured values in Table 6-1-1. Use listed values for those which could not be measured.
|
|
Listed Value
|
Measured Value
|
|
L1
|
100 mH
|
|
|
C1
|
0.1 µ F
|
|
|
C2
|
0.1 µ F
|
|
|
C3
|
0.033 µ F
|
|
|
RL1
|
680 ?
|
|
|
RL2
|
1.6 k ?
|
|
Table 6-1-1
- Construct a Pi filter as illustrated in Fig 6-1-3. Set the signal generator for a 500 Hz, sine wave at 3.0 Vrms. The voltage should be measured at the generator with the circuit connected. Set the voltage with a voltmeter and check both voltage and frequency with the oscilloscope.
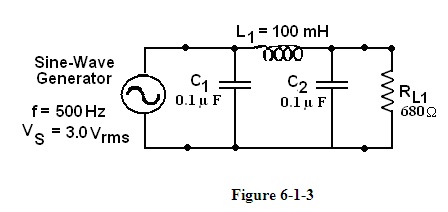
- Measure and record the rms voltage across the load resistor (VRL1) at 500 Hz. Record the measured voltage in Table 6-1-2.
- Change the frequencies of the generator to 1000 Hz. Readjust the generator's amplitude to 3.0 Vrms. Measure VRL1, and enter the data in Table 6-1-2. Continue in this manner for each frequency listed in Table 6-1-2.
- In Plot 6-1-1, plot voltage across load resistor (VRL1) as a function of frequency.
|
Frequency
|
VRL1
|
|
500 Hz.
|
|
|
1000 Hz.
|
|
|
1500 Hz.
|
|
|
2000 Hz.
|
|
|
3000 Hz.
|
|
|
4000 Hz.
|
|
|
8000 Hz.
|
|
Table 6-1-2
- Construct a T filter circuit illustrated in Fig 6-1-4. Set the signal generator for a 500 Hz sine wave at 3.0 Vrms. The voltage should be measured with the circuit connected. Set the voltage with a voltmeter and check both voltage and frequency with the oscilloscope as before.
- Measure and record the voltage across the load resistor (VRL2) for each frequency listed in the Table 6-1-3. Keep the generator voltage at 3.0 Vrms. Graph the voltage across the load resistor (VRL2) as a function of Frequency on Plot 6-1-2.
|
Frequency
|
VRL2
|
|
500 Hz.
|
|
|
1000 Hz.
|
|
|
1500 Hz.
|
|
|
2000 Hz.
|
|
|
3000 Hz.
|
|
|
4000 Hz.
|
|
|
8000 Hz.
|
|
Table 6-1-3
Plot 6-1-2
- Construct the series resonant filter circuit illustrated in Fig. 6-1-5. Set the generator for 3.0 Vrms at 500 Hz.
- Measure and record the voltage across the load resistor (VRL1) for each frequency listed in Table 6-1-4. Graph the voltage across the load resistor as a function of frequency on Plot 6-1-3.
|
Frequency
|
VRL1
|
|
500 Hz.
|
|
|
1000 Hz.
|
|
|
1500 Hz.
|
|
|
2000 Hz.
|
|
|
3000 Hz.
|
|
|
4000 Hz.
|
|
|
8000 Hz.
|
|
Experiment #2: Transformers.
Objective:
After Performing this experiment, you will be able to:
1. Determine the turns ratio for a transformer
2. Show the phase relationship between the primary and secondary for a center-tapped transformer.
3. Compute the turns ration required for matching a signal generator to a speaker.
4. Demonstrate how an impedance-matching transformer can increase the power transferred to a load.
Materials Required:
12.6 V center-tapped Transformer - 1 Piece.
Small speaker: (4 or 8 ?) - 1 Piece.
Impedance matching transformer: (approx 600 ? to 800 ?) - 1 Piece.
Summary of theory:
A transformer consists of two (or more) closely coupled coils that share a common magnetic field. When an ac voltage is applied to the first coil, called Primary, a voltage is induced in second coil, called the Secondary. The voltage that appears across the secondary is proportional to the transformer turns ratio. The turns ratio is found by dividing the number of turns in a secondary winding by the number of turns in the primary winding. The turns ratio, n, is directly proportional to the primary and secondary voltages. That is,
For most work, we can assume that a transformer has no internal power dissipation and that all the magnetic lines in the primary also cut through the secondary - that is, we can assume that transformer is ideal. The ideal transformer delivers to the load 100% of the applied power. Actual transformers have losses due to magnetizing current, eddy currents, coil resistance, and so forth. In typical power application, transformers are used to change the ac line voltage from one voltage to another or isolate ac grounds. For the ideal transformer, the secondary voltage is found by multiplying the turns ration by the applied primary voltage. That is,
VS = n ·VP
Since the ideal transformer has no internal losses, we can equate the power in the primary to the power delivered by the secondary. Since P = V I, we have,
Power = VP · IP = VS · IS
This equation shows that if the transformer causes the secondary voltage to be higher than the primary voltage, the secondary current must be less than the primary current. Also, if the transformer has no load, then there will be no primary or secondary current in the ideal transformer.
In addition to their ability to change voltages and isolate grounds, transformers are useful to change the resistance (or impedance) of a load as viewed from the primary side. The load resistance appears to increase by the turns ratio squared when viewed from the primary side. Transformers used to change the impedance are designed differently from power transformers. They need to transform voltages over a band of frequencies with low distortion. Special transformers called audio, or wideband, transformers are designed for this. To find the correct turns ratio needed to match a load impedance to a source impedance, use the following equation:
In this experiment, you will examine both a power transformer and an impedance-matching transformer and calculate parameters for each.
Procedure:
1. Obtain a low-voltage power transformer with center-tapped secondary (12.6 V secondary). Using an ohmmeter, measure the primary and secondary resistance. Record in the Table 6-2-1.
2. Compute the turns ratio based on the normal line voltage (VP) of 115 V and the specified secondary voltage of 12.6 V. Record this as the computed turns ratio, n, in Table 6-2-1.
3. For safety, we will use a function generator in place of ac line voltages. Connect the circuit illustrated in Fig 6-2-1. Power transformers are designed to operate at a specific frequency (generally 60 Hz.). Set the generator to a 60 Hz sine wave at 5.0 Vrms on the primary. Verify this voltage with an oscilloscope, and adjust as necessary. Measure the secondary voltage. From the measured voltages, compute the turns ratio for the transformer. Enter this value as the measured turns ratio, n, in the Table 6-2-1.
4. Compute the percent difference between the computed and measured turns ratio and enter the result in Table 6-2-1. The present difference is found from the equation:
|
Primary Winding resistance
|
|
|
Secondary Winding resistance
|
|
|
Turns ratio, n (computed)
|
|
|
Turns ratio, n (measured)
|
|
|
% difference
|
|
Table 6-2-1
5. Connect a two-channel oscilloscope to the primary and secondary windings, as illustrated in Fig 6-2-2 (a). Trigger the oscilloscope from channel 1. Compare the phase of the primary side viewed on channel 1 with the phase of the secondary side viewed on channel 2. Then reverse the leads on the secondary side. Describe your observation.