State the project scope and objective

Assignment Help Applied Statistics
Reference no: EM132285582

Six Sigma Black Belt Case Study -

Submit the answer in detail. Answer the following:

Q1. State the project scope and objective.

Q2. Identify the type of errors investigated in the study.

Q3. Suggest, in your opinion, how did they collect the data (it is not stated in the document).

Refer to page 12 to answer (4-7)

Q4. Why did they perform the ANOVA Analysis?

Q5. Which factor is significant?

Q6. In the ANOVA table, explain why the interaction effect was not estimated.

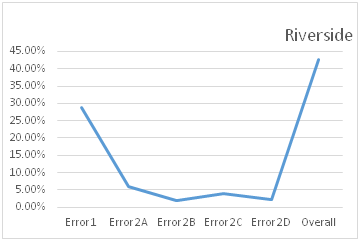
Q7. Draw the factor interactions to check the significance of the interaction effect. Part of the graph is shown below for (riverside location) to help you get started.

1202_figure.png

Q8. On page 16, they constructed the individual chart for # of PROC and P chart for fraction of errors for error 1. Construct a new chart for the number of errors (C-chart) across all errors (1-2D) for Mountain View location. Data should be first combined as shown partially for the first row in the following table

n

number of errors(nonconformities)

1865

595+70+39+27+34=765

Refer to page 23-25 to answer the following:

Q9. Why did they perform the ANOVA on page 23?

Q10. How did they conclude the significance on the factor? Comment based on F and Fcrit

Q11. Why did they perform three t-tests? What is the conclusion of each test and explain how it helps to understand the major source of errors due to (missing entries) error type (state the null and the alternative hypothesis to explain your answer).

Q12. On page 27, they perform regression analysis. Explain why they performed the analysis. Which one of the three regression models do you think is strong (explain your answer)?

Q13. The model assumption verification was not shown in the report. Perform the regression analysis in MiniTab and verify model assumption validity.

Q14. In the improvement phase, Different training programs were used. Which training method was effective. State the null hypothesis and alternative for the effective training method.

Q15. ANOVA can be used instead of t-test to check the training method effectiveness. Perform the analysis using Mintab.

Attachment:- Assignment Files.rar

Reference no: EM132285582

Questions Cloud

Generate a code to break in the range of 0000 to 9999 : Modify your version of the project to the following specifications. Randomly generate a code to break in the range of 0000 to 9999. Use characters not integers.
Regulating a natural monopoly : What do you think is the biggest problem with regulating a natural monopoly?
How much do you already know about social movements : How much do you already know about social movements? Do you actually believe that current social and environmental issues are truly "fixable"? Why or why not?
What profit do you get per year : Annual costs to operate the complex is $1M. If the vacancy rate is 5%, what profit do you get per year? (Chapter 2)
State the project scope and objective : Six Sigma Black Belt Case Study - State the project scope and objective. Suggest, in your opinion, how did they collect the data
The differences in contingency and situational leadership : Compare the differences in contingency and situational leadership. Then, determine the key influences they each have on organizational performance.
Multivariate demand function for smooth sailing sailboats : All questions utilize the multivariate demand function for Smooth Sailing sailboats in C6 on text page 83, initially with:
Prepare a report about the company : Prepare a report about the company. Gilboa characterizes the report as a "public business plan,".
Consider the simplified national income model : Where AD is aggregate demand, C is consumption, and I is investment. Consumption is determined by a behavioral equation, which in this problem takes the form

Reviews

Write a Review

Applied Statistics Questions & Answers

  Hypothesis testing

What assumptions about the number of pedestrians passing the location in an hour are necessary for your hypothesis test to be valid?

  Calculate the maximum reduction in the standard deviation

Calculate the maximum reduction in the standard deviation

  Calculate the expected value, variance, and standard deviati

Calculate the expected value, variance, and standard deviation of the total income

  Determine the impact of social media use on student learning

Research paper examines determine the impact of social media use on student learning.

  Unemployment survey

Find a statistics study on Unemployment and explain the five-step process of the study.

  Statistical studies

Locate the original poll, summarize the poling procedure (background on how information was gathered), the sample surveyed.

  Evaluate the expected value of the total number of sales

Evaluate the expected value of the total number of sales

  Statistic project

Identify sample, population, sampling frame (if applicable), and response rate (if applicable). Describe sampling technique (if applicable) or experimental design

  Simple data analysis and comparison

Write a report on simple data analysis and comparison.

  Analyze the processed data in statistical survey

Analyze the processed data in Statistical survey.

  What is the probability

Find the probability of given case.

  Frequency distribution

Accepting Manipulation or Manipulating

Free Assignment Quote

Assured A++ Grade

Get guaranteed satisfaction & time on delivery in every assignment order you paid with us! We ensure premium quality solution document along with free turntin report!

All rights reserved! Copyrights ©2019-2020 ExpertsMind IT Educational Pvt Ltd