Reference no: EM131003867
PART A:
Question 1:
a. A Pizza Shop monitored (over a two week period) the time taken from placement of order until the pizza was delivered. The data were summarized and the following ogive generated.
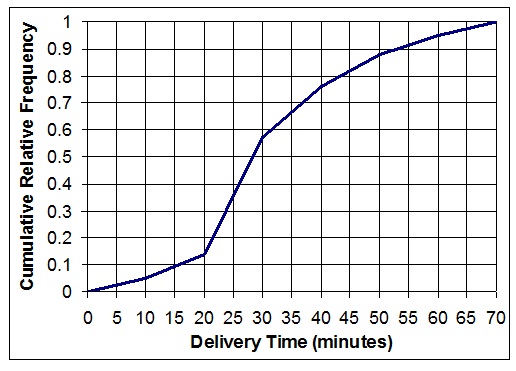
i. Write an appropriate title for this graph
ii. What proportion of pizzas were delivered within 30 minutes ?
iii. If there were 2500 pizzas delivered during the sampling period, calculate how many pizzas took between 15 and 45 minutes to deliver.
iv. The Pizza Shop has decided to offer a refund if pizzas aren't delivered within a certain time period. They calculate that they can afford this refund for 5 percent of their orders. What delivery time should they set as the cut off for this offer?
b. A manufacturer is developing a new nickel-metal hydride battery to be used in mobile phones as a possible replacement for the old nickel-cadmium batteries. The director of quality control decides to evaluate the newly developed battery against the widely used old battery with respect to performance. A random sample of 25 of the old batteries, and 25 of the new batteries are placed in mobile phones of the same brand and model. The performance measure of interest is the talking time (in minutes) prior to recharging. The results are as follows. The times listed are in numerical order, rather than the order in which they were recorded.
Old battery Talking time (in minutes)
220.8 221.7 234.5 236.7 238.7 244.5 244.9 247 247.8 248.8
249.7 250.4 251 251.8 252.5 252.8 254.9 255.4 256.9 261
262 263.3 266.8 270.4 284.4
New battery Talking time (in minutes)
221.1 226.4 242.5 249.4 251.8 252.1 254.1 254.3 257.5 258.3
259.8 261.3 262.3 262.8 263.2 265 265.3 265.3 265.5 266.1
267.3 271.1 275.4 283 292.3
i. Calculate the mean and standard deviation talking time for the old battery. (Use the statistics functions on your calculator to find these values).
The following table shows the talking time descriptive statistics, for the newly developed battery.
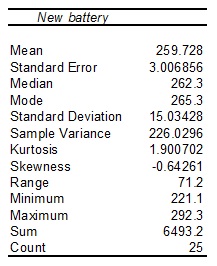
ii. Are the times for each type of battery equally variable? Use values from the descriptive statistics table, together with any other necessary calculations to justify your answer.
The following boxplot can also be used to compare the talking times for the two batteries.
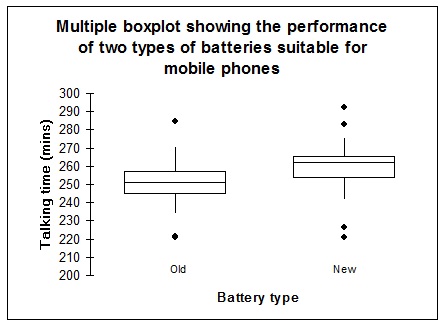
iii. Are the talking times for the old battery skewed? If so, include the direction of skewness and justification for your conclusion.
iv. Which measure of centre is most useful, and which is least useful in describing the average talking time on a mobile phone in which the newly developed battery is used. Explain.
v. From the information provided here, does one battery appear to perform better? Explain.
Question 2:
a. An import-export firm has a 45% chance of concluding a deal to export agricultural equipment to a developing nation, if a major competitor does not bid for the contract, and a 25% probability of concluding the deal if the competitor does bid for it. It is estimated there is a 40% chance that the competitor will submit a bid for the contract.
i. Define each of the simple events and then prepare a probability tree to represent this problem. Ensure the relevant probabilities appear along each branch of the tree.
ii. What is the probability of concluding the deal?
iii. If the firm secures the deal, what is the probability that the competitor had also put in a bid?
b. A Perth interviewer has found that one in five of the people approached will refuse to take part in her survey. Of the next 20 people approached, what is the probability that
i. exactly five will agree to an interview?
ii. at least half will agree to an interview?
c. Beer sales at a Darwin drive-in bottle shop are normally distributed with an average of 3000 litres per week, and a variance of 40 000.
i. Determine the probability that in any particular week, sales will exceed 3200 litres.
ii. Determine the beer sales level that is exceeded for 95% of the weeks.
Question 3:
a. The subject coordinator for QBM117 has determined the average grade for all final exams over the last ten years to be 70.3, with a standard deviation of 9.3. If the Spring '99 class of 180 students studying QBM117 is considered as a sample, find the probability that the class's average score on the final exam will be more than 71.
b. It is claimed on the packaging of MicroPop microwave popcorn that only 2 per cent of its kernels fail to pop. A statistics student believes the percentage to be larger. She decides to test the claim (at the 0.01 significance level). She selects a sample of 2000 kernels and finds that 44 fail to pop.
i. State the hypothesis test.
ii. Determine whether the test results support the packaging claim.
iii. Find the p-value for the test.
iv. Explain how the p-value calculated in iii. can be used to test the hypotheses stated in i.
c. How many prawns should be sampled from a catch if we want to be 95% confident, that the sample mean is no more than 1.4 grams from the actual mean weight of the catch? Assume that the range of weights in the catch is about 17 grams.
Question 4:
a. A computer manufacturer is considering the purchase of a bulk lot of microprocessor chips that are rated at a speed of 233 megahertz (MHz), but the rating is conservative and usually the chips run at a higher speed. Eight chips are randomly selected and tested, and found to have the following speeds in megahertz.
234.3 233.6 232.9 235.2 234.0 232.8 233.8 233.0
Construct a 90% confidence interval to estimate the mean operating speed of the chips in the bulk lot. Assume that the operating speeds are approximately normally distributed.
b. The management of one of the major building societies would like to know whether there is a relationship between the number of people employed by the building societies and the number of building society members (clients). Data on the number of employees and the number of members was collected for a random sample of 48 major building societies in Australia. Simple linear regression analysis was performed on these data and the MS Excel output is provided below.
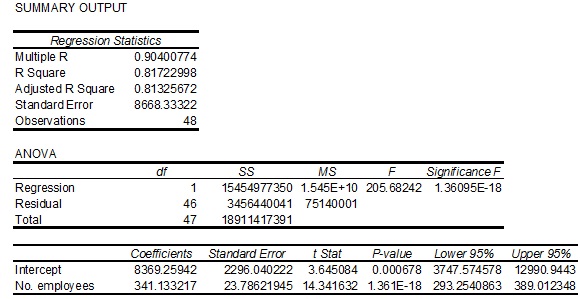
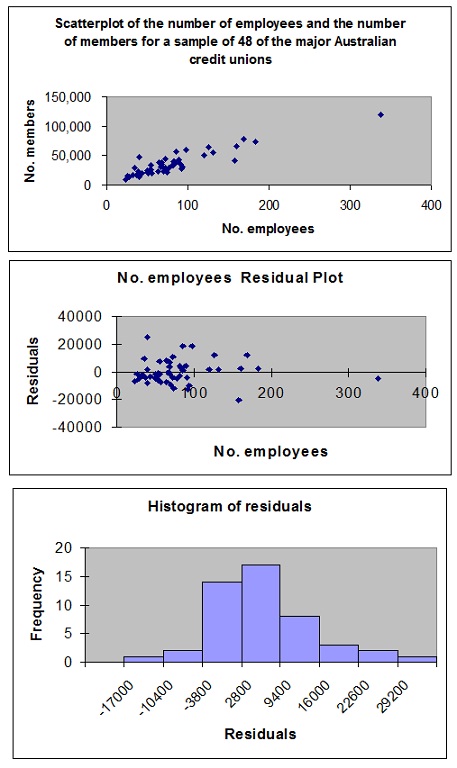
Use the MS Excel output provided to answer the following questions.
i. From the scatterplot provided, comment on the likely relationship between the number of employees and the number of members.
ii. There is an obvious outlier in the data. If this was removed, because it was suspected it was a data entry error, what impact would this have on the relationship proposed in part i.? Explain
iii. Assuming the relationship proposed in i., write down the sample regression equation.
iv. Determine whether the number of employees influences the number of members. An appropriate hypothesis test should form part of this analysis. [Use α = 0.05]
v. Which of the diagnostic plots provided would we examine if we wanted to check whether the fitted model was appropriate for the credit union data? Explain whether the fitted model is appropriate here and how you reached this conclusion.
vi. Find the 95% confidence interval for the expected number of members of credit unions with 220 employees.
Use SSx = 132806.8 and x‾ = 80.935
PART B:
1. Which of the following statements is true?
A. The median must be one of the values of the raw data.
B. The mean must be one of the values of the raw data.
C. The mode does not have to be one of the values of the raw data.
D. The standard deviation must be one of the values of the raw data.
E. The first quartile does not have to be one of the values of the raw data.
2. Which of the following is best for comparing the dispersion of two data sets with different means?
A. Range
B. Variance
C. Standard deviation
D. Boxplots
E. Coefficient of variation
3. Which of the following is false?
A. The standard deviation complements the mean when describing data.
B. The standard deviation must take a positive number.
C. The standard deviation increases as the spread of the data increases.
D. The standard deviation is a good descriptor of skewed data
E. The standard deviation is the square root of the variance.
4. Find the median of the following data: {2, 4, 8, 9, 19, 6}.
A. 7
B. 6
C. 8.5
D. 8
E. 17
5. Which of the following is cannot be determined from the boxplot?
A. The median.
B. The range.
C. The first quartile.
D. The mean.
E. A., B., C., and D. can all be determined from the boxplot.
6. The figure following displays a density curve with three points marked. Which of the following statements about these three points is correct?
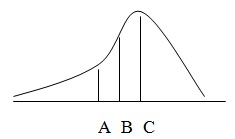
A. A represents the mean, B the median and C the mode.
B. A represents the median, B the mode and C the mean.
C. A represents the mode, B the median and C the mean.
D. A represents the mean, B the mode and C the median.
E. A represents the median, B the mean and C the mode.
Use the following information to answer questions 7. and 8.
25% of the population in a given area is exposed to a television commercial for Ford automobiles, and 34% is exposed to Ford's radio advertisements. Also, it is known that 10% of the population is exposed to both means of advertising.
7. If a person is selected at random, from the population in this area, what is the probability that he or she was exposed to at least one of the two modes of advertising?
A. 0.59
B. 0.1
C. 0.49
D. 0.51
E. 0.69
8. The events exposed to a television commercial for Ford and exposed to a radio commercial for Ford are
A. mutually exclusive events.
B. independent events.
C. dependent events.
D. disjoint events.
E. complementary events.
Use the following information to answer questions 9. and 10.
Many Telstra customers now choose to pay their telephone bill by phone, using a credit card. Over the past year, Telstra have found that on average, 10 customers per minute, phone in to pay their bill. If we assume these customers phone in randomly and independently,
9. What is the probability of fewer than 7 customers phoning to pay their bill in the next minute?
A. 0.220
B. 0.090
C. 0.012
D. 0.130
E. 0.063
10. What is the probability of exactly 8 customers ringing to pay their bill in the next 30 seconds?
A. 0.333
B. 0.065
C. 0.932
D. 0.113
E. 0.036
Use the following information to answer questions 11. and 12.
The number of orders for installation of a computer information system arriving at an agency per week is a random variable X with the following probability distribution.
X 0 1 2 3 4 5 6
P(X) 0.10 0.20 0.30 0.15 0.15 0.05 0.05
11. What is the probability that either 4 or five orders will arrive in a given week?
A. 0.15
B. 0.05
C. 0.0075
D. 0.20
E. 0.85
12. Assuming independence of weekly orders, what is the probability that three orders will arrive next week and the same number of orders the following week?
A. 0.2025
B. 0.0225
C. 0.45
D. 0.30
E. 0.15
13. Given Z is the standard normal random variable, find zo such that P(Z > zo) = 0.12
A. zo = 0.0478
B. zo = 0.38
C. zo = 1.175
D. zo = 0.30
E. zo = -1.175
14. Given Z is the standard normal random variable, find P(2 < Z < 3)
A. 0.9785
B. 0.9759
C. 0.0215
D. 0.4785
E. 0.0013
15. When performing a hypothesis test at α = 0.05, the p-value is calculated as 0.0411. The statistician
A. needs more information before reaching a conclusion.
B. should reject the null hypothesis.
C. should increase the level of significance.
D. should not reject the null hypothesis.
E. should reject the p-value.
16. Samples are drawn from a population and the sample means calculated. The resulting sampling distribution of the sample mean
A. has a variance that is smaller than the population variance.
B. has an expected value that increases with sample size.
C. is always normal.
D. always has the same shape as the population.
E. has a variance that will increase with increasing sample size.
17. A political party wants to investigate whether the proportion of people voting for it has changed from the previous proportion of 0.5. 110 people from a random sample of 200 indicated they would vote for the party. The appropriate hypotheses to test this would be:
A. Ho : p = 0.5 HA : p ≠ 0.5
B. Ho : p = 0.5 HA : p > 0.5
C. Ho : p = 0.55 HA : p ≠ 0.55
D. Ho : p = 0.55 HA : p > 0.55
E. Ho : p = 0.55 HA : p < 0.55
18. Given the same sample proportion of 0.45, which of the following would lead to the widest confidence interval for estimating the population proportion?
A. A 95 percent confidence interval with n=100
B. A 95 percent confidence interval with n=50
C. A 99 percent confidence interval with n=100
D. A 99 percent confidence interval with n=50
E. A 90 percent confidence interval with n=100
Use the following information to answer question 19. and 20.
A company that has the distribution rights to home video sales of previously released movies would like to estimate the correlation between box office gross and the number of videos sold. The data for a sample of 30 movies together with their box office gross (in millions of dollars) and the number of videos sold (in thousands) were analysed using a simple linear regression. The output appears below.
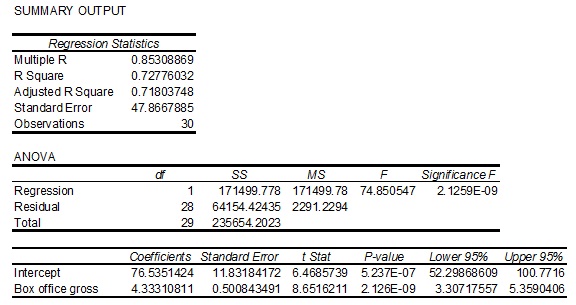
19. The correlation coefficient for these data is
A. 0.73
B. -0.73
C. 0.85
D. -0.85
E. unable to be determined from the information provided.
20. The company would like to determine whether there is a statistically significant linear correlation between box office gross and number of videos sold. The appropriate set of hypotheses would be
A. Ho : ρ = 0 HA : ρ ≠ 0
B. Ho : β1 = 0 HA : β1 > 0
C. Ho : r = 0 HA : r ≠ 0
D. Ho : ρ = 0 HA : ρ > 0
E. Ho : β1 = 0 HA : β1 < 0