Reference no: EM13839959
1.Body temperatures (in F) were measured on 30 healthy individuals, resulting in the data H1.1.
a) Make a histogram and a stem and leaf plot . Comment on the shape of distribution.
b) Calculate the mean, median ,mode and standard deviation.What do these statistics suggest about the shape of the distribution?
c) Are there any outliers? If you think that the range of variation is excessive, note that medical studies have found that normal body temperature actually varies between individuals up to 4.8oF and for the same individual up to 1.09oF.
d) A resistant version of the mean is a trimmed mean. An α-trimmed mean, refers to the mean computed after trimming away an α fraction of the observations from each end of the ordered data set. Calculate a 10% -trimmed mean for this data. How does a 10% trimmed mean compare with the sample mean? Does this comparison suggest any outliers?
e) The coefficient of variation (CV) is a relative measure of dispersion that expresses the sample standard deviation (SD) in terms of the sample mean, CV= s/x. Calculate the CV for this data.
2."For all the speeches given, the commercials aired, the mud splattered in any election, a hefty percentage of people decide whom they will vote for only at the last minute." Suppose that a sample of people were asked, "When did you finally decide whom to vote for in the presidential election?" These answers were given:
Answer Percent
Only in the past 3 days 17%
In the past week 8
In the past 2 weeks (after the debates) 18
In early fall (after the convention) 24
Earlier than that 33
a. Would you use a pie chart or a bar chart to graphically describe the data? Why?
b. Draw both charts .
c. What does the chart tell you about the reliability of election polls taken early in the election campaign?
3.Stem-and-leaf displays can be used to compare distributions for two groups using a back-to-back stem- and-leaf display. In such a display, one group is shown on the left side of the stems, and the other group is shown on the right side. When the leaves are ordered, the leaves increase as one moves away from the stems. The following stem-and-leaf display shows the money earned per tournament entered for the top 30 money winners in the 2008-09 Professional Bowlers Association men's tour and for the top 21 money winners in the 2008-09 Professional Bowlers Association women's tour.
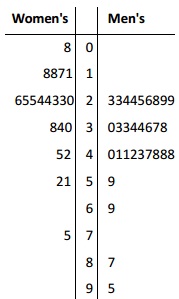
The leaf unit for this display is 100. In other words, the data used represent the earnings in hundreds of dollars. For example, for women's tour, the first number is 08, which is actually 800. The second number is 11, which actually is 1100.
a. Do the top money winners, as a group, on one tour (men's or women's) tend to make more money per tournament played than on the other tour? Explain how you can come to this conclusion using the stemand-leaf display.
b. What would be a typical earnings level amount per tournament played for each of the two tours?
c. Do the data appear to have similar spreads for the two tours? Explain how you can come to this conclusion using the stem-and-leaf display.
d. Does either of the tours appears to have any outliers? If so, what are the earnings levels for these players?
|
Supplies consumed during the month totalled
: Identify the impact on the balance sheet for that month if the following information is not used to adjust the accounts. 1. Supplies consumed during the month totalled $3,000. 2. Interest accrues on notes payable at the rate of $200 per month.
|
|
Balance of cole''s enterprise contains revenue
: Before month-end adjustments are made, the February 28 trial balance of Cole's Enterprise contains revenue of $11,000 and expenses of $8,900. Adjustments are necessary for the following items:Depreciation for February is $1,200.
|
|
The investment policy statement of an institution
: The investment policy statement of an institution must be concerned with all of the fol- lowing except: Its obligations to its clients. The level of the market. Legal regulations. Taxation.
|
|
While industrialised countries manufacturing tariffs
: While industrialised countries manufacturing tariffs have been cut significantly as a result of the past GATT rounds, agriculture remains heavily protected in many countries. Briefly discuss the welfare effects on domestic and international consumers..
|
|
Shape of the distribution
: Calculate the mean, median ,mode and standard deviation.What do these statistics suggest about the shape of the distribution?
|
|
Healthcare economics
: Healthcare economics Explain how a change in each of the following factors would alter the shape of the total product curve for medical care. A. An increase in education.
|
|
Counseling employees in the selection of asset classes
: Under the provisions of a typical corporate defined benefit pension plan, the employer is responsible for: Paying benefits to retired employees. Investing in conservative fixed-income assets. Counseling employees in the selection of asset classes. Ma..
|
|
The labor demand and supply curves
: The labor demand and supply curves are respectively: Ld = a+b·w and Ls = c+d·w, where a, b, c, and d are parameters of the model, w is the wage, Ld and Ls denote labor demand and supply, respectively.A. What are the values of the parameters c and d t..
|
|
Double-entry accounting services begin operations
: Double-entry Accounting Services begin operations on July 1. It allows its clients 90 days to pay for services received. On the other hand, the company's suppliers require payment for their goods and services within 30 days. Double-entry prepaid its ..
|