Reference no: EM131938736
Applied Linear Models Assignment
EXERCISE 1: Analysis of NZ population data
We consider data collected by Statistics New Zealand on the population growth in New Zealand over 13 years from 1991 to 2003. The variables measured for each year are:
Immigration Total number of new arrivals
Fertility.Rate Number of children per woman
Male.Life.Expectancy Life expectancy of males born that year
Population Total number of permanent residents
A first glance at the data reveals the following relationships:
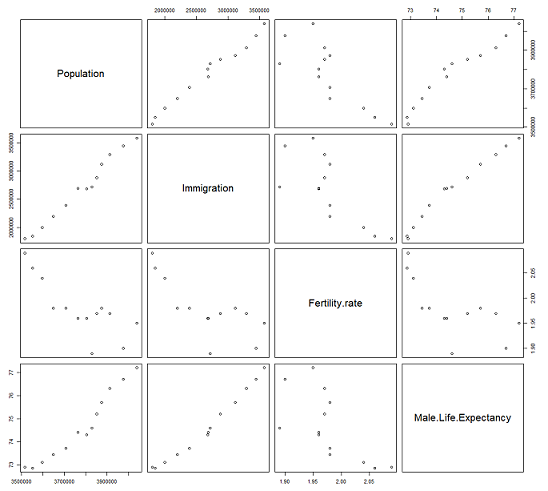
(a) Based on the scatterplots displayed, make at least two comments on how useful the explanatory variables, Immigration, Fertility.rate and Male.Life.Expectancy are for predicting Population.
(b) A linear regression model of Population on the other variables was fitted in R, producing the following output (in which some elements have been obscured by a # sign).
What is the correct value for the t-statistic for Immigration that has been obscured in this output?
(c) What are the correct degrees of freedom for the F-statistic that have been obscured in this output?
(d) Write down the appropriate hypotheses, the test statistic and P-value for conducting an omnibus F test to see whether Population is related to at least one of the covariates. What is your conclusion?
(e) What (if anything) can be said about the relationship between Population and the covariate Male.Life.Expectancy based on the above output from R? Explain your reasoning.
EXERCISE 2: Analysis of Gapminder data
Hans Rosling who died in early 2017 can be considered as one of the pioneering statisticians of our time in terms of his work on the power of data visualisation. In 2005, he founded Gapminder, a foundation that provides free international statistics as well as tools to convert the data into interactive visualisations. This exercise is concerned with Gapminder data, stored in Gapdata.csv, containing the median age of women at their first marriage as well as the fertility rate on average of women in 175 countries worldwide in 2005.
You can read these data into R, and store them as a data frame Gapdata, with the command
The variables are Country, Age1stMarrigae and FertilityRate.
(a) Produce a plot of fertility rate versus age at first marriage. Comment on any features you notice.
(b) Fit a simple linear regression model for fertility rate (as response) against age at first marriage. Write down the R code that you use and present the summary table of estimated coefficients and their associated standard errors. Interpret the R-squared value.
(c) What is the (estimated) correlation between the estimated coefficients of Age1stMarriage and the intercept?
(d) Provide diagnostic plots for the model fitted and comment on whether any of the assumptions for simple linear regression are violated.
(e) Which observation has the highest standardised residual value? Is it an influential data point?
EXERCISE 3: Analysis of Statistics NZ Data
The data set export.txt comprises data collected by Statistics New Zealand on all exports, dairy-related export totals and the number of newly registered job seekers over the time period of June 1998 to December 2015.
The following variables are included:
Variable - Description
Jobseekers - Number of job seekers
Total Exports - Value of exports of all goods in billions of dollars
MilkExports - Value of dairy-related exports in billions of dollars
Aims of Analysis: The dairy industry is a major component of the New Zealand economy. It is of interest to study the extent to which the economy as a whole reacts to changes specifically in the dairy sector. With that in mind, the aim of this analysis is to fit a suitable linear model for predicting total exports in terms of the other variables. Take care to assess the quality of your model, and modify it if necessary.
What to Hand In: For this exercise you should hand in a mini-report no longer than a single side of A4 paper (excluding any relevant Figures, Tables or computer output, which can be attached as an appendix). You will be marked down for exceeding this page limit. The aim of the mini-report is to convey the aims, methodology and results of your data analysis in a concise, readable fashion. It is strongly recommended that you structure your report into sections, Introduction, Methodology, Results and Discussion.
(a) Introduction: Summarise the data and the aims of the analysis.
(b) Methodology: Describe the statistical methods that you use (technical details not required). They should be appropriate considering the data used.
(c) Results: Describe the results of your analysis and their correct interpretations.
(d) Discussion: Draw conclusions (based on your results) as necessary. Discuss any interesting issues arising from your analysis.
(e) Exposition: Your mini-report should be well organized. You should aim to write in a concise, yet readable, manner.
Attachment:- Assignment Files.rar