Reference no: EM13188595
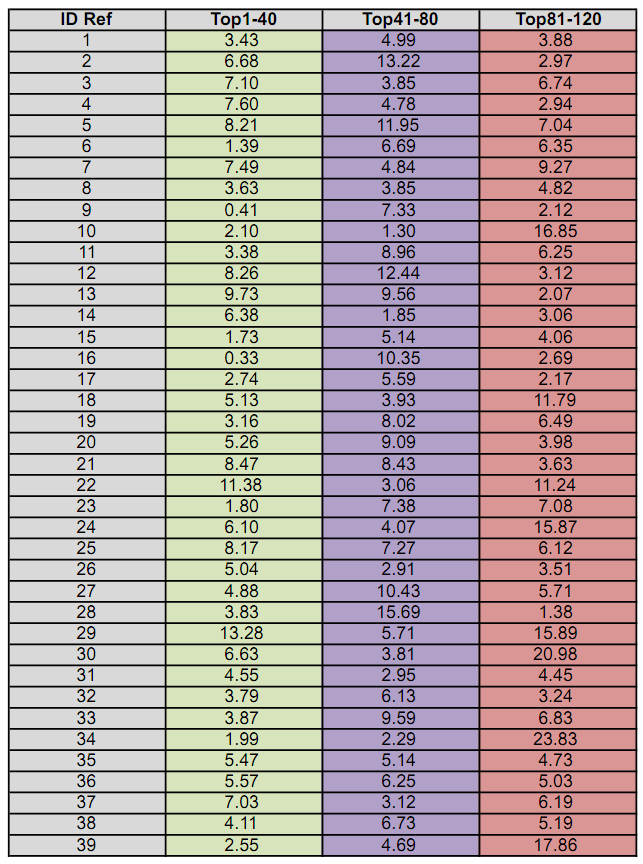
The dividend yield on shareholders' funds of Australia's top 120 companies for the week ended Friday 10 July 2009 is recorded in the data file.
1. Column 1 stores the dividend yield for the top 1-40 companies ranked by market capitalisation
2. Column 2 stores those for the top 41-80 companies and
3. Column 3 for the top 81-120 companies.
To understand the meaning of these yields, consider 3.43% yield that was realised on the first company's shares in 2008. This means that $ 100 invested in the shares of that company at the beginning of 2008 would have yielded a profit of $3.43 over the year, leaving you with a total of $103.43 at the year's end. The data is also available to you in an excel spread-sheet for your convenience.
In the exercise that follows, you are required to complete your calculations using the manual methodology taught in class and may supplement it with the use of excel functions to verify calculations. This will also help you in your preparations for your final exams.
Required:
Question 1
Organise the data in appropriate class intervals and draw a histogram of the frequency distribution.
Question 2
Find the Mean, Median, Range, Standard Deviation and Coefficient of Variation of the yield for the top 40 Australian companies.
Question 3
Repeat the exercise outlined in Question 2 for data covering the top 41-80 companies and the top 81-120 companies
Question 4
Is there any major difference in the dividend yield between the three groups of companies?
|
What are the relevant markets in this model
: Construct a circular-flow diagram like the one found in this chapter to represent the sector of the economy devoted to collage education: collages and universities represent firms, and house holds both consume education and provide facilty and stu..
|
|
What future amount of money will be accumulated
: WHAT FUTURE AMOUNT OF MONEY WILL BE ACCUMULATED 10 YEARS FROM NOW BY INVESTING $1000 NOW PLUS $2000 FIVE YEARS FROM NOW AT 6% INTEREST COMPOUNDED SEMI-ANNUALLY
|
|
Diagnostic and forensic analyses
: When should common diagnostic and forensic analyses be utilized to assess the effectiveness of a company's marketing activities?
|
|
Do loop with sub routines to print what each company owes
: Assume you have a company called Rampage Seminar Inc., which offers programming seminars to companies. Your price per person depends on the number of people the company registers. Write a basic program using If then else and Do loop with sub routines..
|
|
Organise the data in appropriate class intervals
: Organise the data in appropriate class intervals and draw a histogram of the frequency distribution and find the Mean, Median, Range, Standard Deviation and Coefficient of Variation of the yield for the top 40 Australian companies.
|
|
Physical or cognitive issues-retirement
: What are some physical or cognitive issues older adults face as one enters retirement? What issues come with aging? What issues that can be avoided if older adults take better care of themselves. Give examples. Pls answer in 130 words or less.
|
|
How might you construct a measure of the change in the price
: Define inflation. Assume that you live in a simple economy in which only three goods are produced and traded: fish, fruit, and meat. Suppose that on January 1, 2007, fish sold for $2.50 per pound, meat was $3.00 per pound, and fruit was $1.50 per ..
|
|
Integrated into managed care
: Name some reasons why providers have integrated into managed care and whether you think managed care has run its course in terms of being able to manage health escalating costs, and if so, will it be replaced by some other form of care provision.
|
|
Which type of market do individual firms have no incentive
: The payoff matrix below shows the payoffs for two coffee manufacturers, Cambridge and Greystone, which are deciding whether to advertise. The blue payoffs show Cambridge's profit for different strategies selected by each firm. The orange payoffs s..
|