Reference no: EM137974
1. A forester wishes to predict the volume (in cubic feet) of usable lumber in a certain species of tree from the height (in feet) and diameter (in inches) of the trees. The height and diameter of 31 trees of a certain species were measured, the trees were cut down, and the volume of usable lumber was determined. The multiple linear regression model
Volume = β0 + β1(Diameter) + β2(Height) + βi
is assumed to hold, where the deviations i are independent and Normally distributed with mean 0 and standard deviation . This model is fit to the data using the method of least squares using statistical software, and the following ANOVA table is obtained.
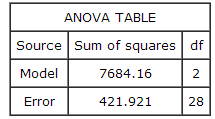
The value of MSE is
A. 15.069.
B. 421.921.
C. 3842.08.
2. A forester wishes to predict the volume (in cubic feet) of usable lumber in a certain species of tree from the height (in feet) and diameter (in inches) of the trees. The height and diameter of 31 trees of a certain species were measured, the trees were cut down, and the volume of usable lumber was determined. The multiple linear regression model
Volume = β0 + β1(Diameter) + β2(Height) + βi
is assumed to hold, where the deviations i are independent and Normally distributed with mean 0 and standard deviation . This model is fit to the data using the method of least squares using statistical software, and the following ANOVA table is obtained.
We wish to test the hypotheses
H0: 1 = 2 = 0, Ha: at least one of the j is not 0.
using the ANOVA F test. The value of the F statistic is
A. 0.071.
B. 18.21.
C. 254.97.
|
What is the magnitude of the acceleration
: Two ocean liners, each with a mass of 40,000 metric tons, are moving on parallel courses, 92 m apart. What is the magnitude of the acceleration of one of the liners toward the other due to their mutual gravitational attraction? Care for the ships as ..
|
|
Compute an analysis of variance
: I have computed an analysis of variance for three groups with 10 observations per group. Evaluate the degrees of freedom for the F test
|
|
Using m-method solve the above lp
: Using M-method solve the above LP. Does the problem has alternative optimal solution? If so, find all the alternative optimal solutions.
|
|
Solve using simplex method
: Q. solve using simplex method, Hence using the sensitivity analysis, find the new optimal solution of the LPP if the availability of the second constraint is changed from 11 to 15
|
|
Multiple linear regression model - anova table
: This model is fit to the data using the method of least squares using statistical software, and the following ANOVA table is obtained
|
|
Average number of putts per round
: Based on these results, the proportion of the variation in 1993 winnings that is explained by the average number of putts per round and driving distance
|
|
Example on multiple linear regression model
: This model is fit to the data using the method of least squares using statistical software, and the following parameter estimates and their standard errors are obtained.
|
|
Evaluate average driving distance
: An old saying in golf is "you drive for show and you putt for dough." The point is that good putting is more important than long driving for shooting low scores and hence winning money.
|
|
Multiple regression model
: where the deviations εi are assumed to be independent and Normally distributed with mean 0 and standard deviation σ. This model was fit to the data using the method of least squares. The following results were obtained from statistical software.
|