Reference no: EM131004031
Use the following information to answer question 1. and 2.
The following data represent the number of colour television sets manufactured each day at a given factory, for a random sample of 15 days.
15 16 19 14 12 22 23 25
20 32 17 34 25 40 41
1. Which of the following statements about the descriptive statistics for these data are correct?
A. the mean = 23 and the median = 22
B. the mean = 23.7 and there is no mode;
C. the range = 29 and the median = 22
D. the range = 29 and the mean = 23
E. the median = 20 and the mean = 23.7
2. The coefficient of variation is
A. 0.3
B. 0.38
C. 0.39
D. 8.9
E. 79.6
3. The boxplot following shows the distribution of student marks on a mid session test where a mark of 50% or above is considered a pass.
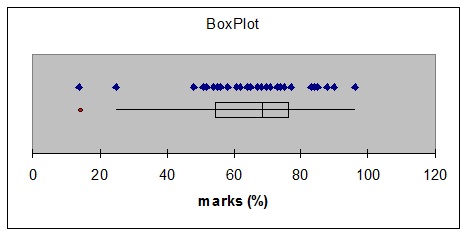
Choose the statement which correctly describes the performance of students on this test.
A. All the students passed the test.
B. 50% of the students failed the test.
C. The median mark on the test was 60%
D. More than 75% of the students passed the test.
E. 25% of students scored a mark of more than 80%.
4. Which of the following is an example of a discrete random variable?
A. The time a person waits in line at the supermarket.
B. The weight of a car.
C. The number of customers that enter a store daily.
D. The time it takes a worker to inspect a machine.
E. All of the above are examples of discrete random variables.
5. Let X be a random variable with the following probability distribution:
x 0 1 2 3
p (x) 0.1 0.3 0.4 0.2
The expected value and variance of this distribution would be
A. E(X) = 1.5 and V(X) = 3.7
B. E(X) = 1.7 and V(X) = 3.7
C. E(X) = 1.5 and V(X) = 1.45
D. E(X) = 1.5 and V(X) = 0.09
E. E(X) = 1.7 and V(X) = 0.81
6. A couple plans to have three children. Assume that the probability of having a boy is 0.5. What is the probability of having at least one girl?
A. 0.875
B. 0.125
C. 0.500
D. 0.375
E. 0.250
7. If P(A and B) = 0.09, P(A) = 0.4 and P(B) = 0.2, find the probability of A given that B has occurred.
A. 0.225
B. 0.018
C. 0.036
D. 0.450
E. 0.080
8. What type of scale is the measurement of the salaries of lecturers?
A. a nominal scale
B. a discrete scale
C. a ratio scale
D. an ordinal scale
E. an interval scale
Use the information following to answer questions 9. and 10.
A used car company determined that 30% of customers made a complaint about the car, within one month of purchase.
9. What is the probability that out of 10 randomly selected customers, only one made a complaint within one month of purchase?
A. 0.012
B. 0.028
C. 0.149
D. 0.121
E. 0.234
10. What is the probability that out of 10 randomly selected customers, more than three made a complaint within one month of purchase?
A. 0.850
B. 0.617
C. 0.350
D. 0.267
E. 0.650
11. A bank officer finds that he serves an average of 1.4 customers every 5 minutes. If the customers arrive randomly and independently, what is the probability that in the next 5 minutes, the bank officer serves exactly two customers?
A. 0.251
B. 0.060
C. 0.809
D. 0.242
E. 0.980
12. If Z is the standard normal random variable, then P(Z > -2.32) is
A. 0.9898
B. 0.4898
C. 0.9893
D. 0.0102
E. 0.0002
13. If Z is the standard normal random variable, then P(0.3 ≤ Z ≤ 2.4) is
A. 0.6097
B. 0.3739
C. 0.3903
D. 0.5972
E. 0.3612
Use the following information to answer questions 14. and 15.
Models of the pricing of stock options make the assumption of a normal distribution. An analyst believes the price of a particular stock option is a normally distributed random variable with mean $8.95 and variance 4.
14. Find the probability that this particular stock option exceeds $11.00.
A. 0.3485
B. 0.0968
C. 0.1515
D. 0.1915
E. 0.3085
15. The analyst would like to determine the value a, such that there is a 90% chance that the price of the option would be greater than this value. Find a.
A. $11.51
B. $8.45
C. $9.45
D. $8.75
E. $6.39
16. Consider a population whose distribution is non-normal with σ = 0.5 and μ = 10.2. Assume the following sample results were obtained: n = 40, X‾ = 12.5. Under these circumstances, the distribution of the sample mean has the following properties:
A. approximately normal, mean = 10.2, standard deviation = 0.5.
B. non-normal, mean = 12.5, standard deviation = 0.08.
C. approximately normal, mean = 10.2, standard deviation = 0.08.
D. approximately normal, mean = 12.5, standard deviation = 0.08.
E. non-normal, mean = 10.2, standard deviation = 0.08.
17. The two events A and B are independent with P(A) = 0.2 and P(B) = 0.35. Find P(A|B)
A. 0.2
B. 0
C. 0.07
D. 0.55
E. It is not possible to find P(A|B) due to insufficient information.
18. A pie chart is most useful for describing
A. qualitative data and relative frequencies.
B. quantitative data and frequencies.
C. quantitative data and relative frequencies.
D. qualitative data and frequencies.
E. qualitative data and cumulative frequencies.
19. Consider the following data on the number of students who either passed or failed a statistics exam.
Fail Pass
Men 28 272
Women 10 190
Given that a man has been randomly selected, the probability that he failed the exam is
A. 0.737
B. 0.093
C. 0.907
D. 0.056
E. 28
20. For a continuous uniform distribution with limits of 10 and 15, the range defined by two standard deviations either side of the mean is
A. 8.3 to 16.7
B. 9.6 to 15.4
C. 7.1 to 12.9
D. 10.0 to 15.0
E. 11.1 to 13.9