Reference no: EM131004059
Use the following information to answer questions 1. and 2.
The following data represent the daily number of visitors to a small craft shop in Yackandandah. The data were collected over a 16 day period and are ordered numerically (not chronologically).
151 164 228 235 267 270 271 289 336 347 653 688 702 840 949 975
1. The mean and standard deviation number of visitors to the shop are
A. 460.3 and 288.7 respectively.
B. 460.3 and 279.6 respectively.
C. 461 and 288.7 respectively.
D. 460.3 and 83 369.6 respectively.
E. 460 and 279.6 respectively.
2. The interquartile range for the number of visitors to the shop is
A. 453
B. 435
C. 444
D. 467
E. 421
3. Which of the following data types can be displayed using a histogram?
A. Interval level data.
B. Nominal level data.
C. Discrete data.
D. Qualitative data.
E. Ordinal level data.
4. Which of the following statements is true?
A. Parameters describe samples.
B. Statistics describe samples.
C. Parameters describe populations.
D. Statistics describe populations.
E. B. and C. are both true.
Use the following information to answer questions 5. and 6.
The nuclear industry has made a concerted effort to significantly reduce the number of unplanned rapid emergency shutdowns of a nuclear reactor. The boxplot following shows the number of such unplanned shutdowns at each of 56 US nuclear reactor units.
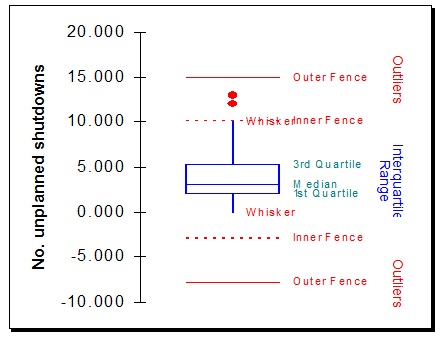
5. After a close examination of the boxplot we can conclude that
A. The mean number of unplanned shutdowns at each nuclear unit was approximately 3.
B. The modal number of unplanned shutdowns at each nuclear unit was approximately 5.
C. The distribution of the number of unplanned shutdowns is negatively skewed.
D. The number of unplanned shutdowns at each nuclear unit is normally distributed.
E. The median number of unplanned shutdowns at each nuclear unit was approximately 3.
6. The maximum number of unplanned shutdowns was
A. 10.
B. 12.
C. 13.
D. 15.
E. unable to be determined.
Use the following information to answer questions 7. and 8.
An accounting firm has advertised the availability of its report describing recent changes to the federal Income Tax Act. The first 200 callers requesting a copy of the report were classified in the following table according to the medium by which the caller became aware of the report and the caller's primary interest.
Medium
Primary interest Radio Newspaper Word of mouth
Personal tax 34 20 26
Corporate tax 36 70 14
7. One caller is selected at random, what is the probability the caller was primarily interested in corporate tax?
A. 0.18
B. 0.6
C. 0.35
D. 0.07
E. 0.3
8. One caller is selected at random, what is the probability the caller became aware of the report through the radio or the newspaper given that he was primarily interested in corporate tax.
A. 0.3
B. 0.12
C. 0.53
D. 0.07
E. 0.88
Use the following information to answer questions 9. and 10.
A can company reports the average number of breakdowns on an 8 hour shift to be 1.5. The breakdowns occur randomly and independently.
9. What is the probability that there will be exactly two breakdowns in the midnight to 8am shift?
A. 0.809
B. 0.558
C. 0.125
D. 0.251
E. 0.271
10. What is the probability of no breakdowns during three consecutive shifts? (Assume the machine operates independently across shifts)
A. 0.011
B. 0.223
C. 0.669
D. 0.335
E. 0.038
11. A processor in Sydney produces electronic chips, of which 30% are defective. If 15 chips are selected at random from the chips produced that day, what is the probability that there will be fewer than 4 defective chips in the sample?
A. 0.127
B. 0.297
C. 0.515
D. 0.218
E. 0.170
12. Z is the standard normal random variable, find P(Z<-1.5)
A. 0.3531
B. 0.1469
C. 0.9332
D. 0.4332
E. 0.0668
13. Z is the standard normal random variable. Find zo if P(Z < zo) = 0.85
A. zo = 0.39
B. zo = 1.04
C. zo = -0.39
D. zo = -1.04
E.zo = 0.3023
14. The standard error for the sample mean gives a measure of
A. the dispersion of values in the sample.
B. the dispersion of values in the population.
C. how far away a particular sample mean is from the population mean.
D. the dispersion of the values of the sample mean for all possible samples.
E. the variability of the data.
Use the following information to answer questions 15. and 16.
The random variable X is normally distributed, with a mean of 10 and a standard deviation of 2.
15. Find P(X ≥ 6)
A. 0.0456
B. 0.9544
C. 0.9772
D. 0.4772
E. 0.0228
16. Find P(11 ≤ X ≤ 14)
A. 0.2857
B. 0.7143
C. 0.3313
D. 0.6687
E. 0.2143
Use the following information to answer question 17. and 18.
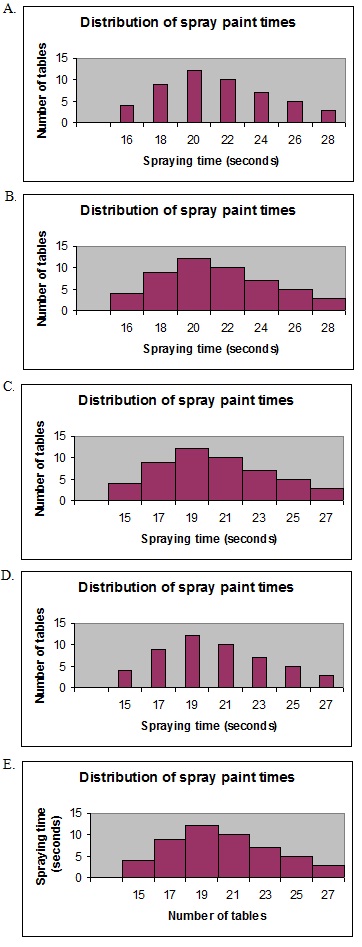
The frequency distribution following shows the time it takes a worker to spray paint each of 50 table tops in a furniture factory.
Painting time (seconds) Number of tables
>14 up to and including 16 4
>16 up to and including 18 9
>18 up to and including 20 12
>20 up to and including 22 10
>22 up to and including 24 7
>24 up to and including 26 5
>26 up to and including 28 3
17. The mean and standard deviation time to paint a table top, calculated from the grouped data is
A. 20.36 and 3.26 respectively.
B. 20.36 and 3.29 respectively.
C. 20.86 and 3.29 respectively.
D. 20.86 and 3.26 respectively.
E. 20.36 and 10.85 respectively.
18. The histogram, constructed in MSExcel, which most correctly displays the information presented in the frequency distribution above is
19. For a continuous uniform distribution with limits of 20 and 40, the range defined by one standard deviation either side of the mean is
A. 25.77 to 45.77
B. -3.33 to 63.33
C. 18.45 to 41.54
D. 10 to 50
E. 24.23 to 35.77
20. On average, containers of frozen vegetables in storage lose 6.5 grams in weight with a standard deviation of 1.8 grams. What is the probability that a random sample of 36 containers will have a mean loss of weight in excess of 7.0 grams?
A. 0.0475
B. 0.4525
C. 0.0485
D. 0.3897
E. 0.1103