Is this cross-sectional or time series data

Assignment Help Business Management
Reference no: EM131207932

During this course, you will be graded on three dimensions:

1. your ability to identify the correct analytical tool to use,

2. your ability to execute the analysis you have selected,

3. your ability to interpret the results of the analysis.

To that end, the assignments will try to reinforce those particular skills by directly targeting these dimensions.

Perform all of your work in the Excel spreadsheet, including your text responses. Save your work as LastName.FirstInitial.Chapter 2 HW. When complete, click the heading to attach your file and submit the homework in Blackboard.

Identify

Q1) Examine the data set on the worksheet Q1. This is fictional data from a survey of 500 randomly selected households. A definition for each variable (unless self-explanatory) can be found in the comments section (place your cursor over any cell with a little red triangle - a comment box will pop up). Answer the following:

a) Is this cross-sectional data or time series data?

b) Is this a population or a sample?

c) Ignoring the identifier variable Household, state the variable type and sub-type for each variable (categorical and ordinal or nominal, or numerical and discrete or continuous.)

d) If you wished to examine the distribution of the variable Monthly Payment, what would you do? List any graphs and calculations you think appropriate.

Q2) Examine the data set on the worksheet Q2. This shows the percent of children (those under 18 years of age) living below the poverty line in the United States from 1959 to 2008. Answer the following:

a) Is this cross-sectional or time series data?

b) Identify the variable type and sub-type for both variables.

c) If you would like examine how successful the United States has been in its efforts to "win the war against poverty" for the nation's children, what type of graph would best answer this question?

Execute

Q3) Create the following graphs. StatTools should place each graph on a new worksheet in your file (if it does not, change the default in Utilities/Application Settings/Placement to Active Workbook.) Don't forget that it is necessary to define the data sets within StatTools (use the option StatTools/Data Set Manager) before you may create a graph.

a) For the data in sheet Q1, create a bar graph for the variable Location. Use the COUNTIF function; you will not need StatTools for this part of the question.

b) Using the data in sheet Q1, create a histogram for the variable Utilities. Don't be afraid to redo it a couple of times (resetting the number of bins or the "span" of the bins) until you get one that is satisfactory and revealing.

c) Again, for data in sheet Q1, create a boxplot with the variable First Income.

d) The data in sheet Q3 contains monthly interest rates on 30-year and 15-year fixed-rate mortgages from 1992-2009. Create a time-series graph that shows both rates on a single graph. Don't forget to use the date as a label.

Q4) The data set in worksheet Q4 lists 204 employees at the (fictional) company Beta Technologies.

Calculate the following values for the variable Salary:
i. The average/mean
ii. The median
iii. The standard deviation
iv. The maximum, minimum, and range
v. The 1st and 3rd quartiles and the inter-quartile range
vi. The salary that 45% of employees earn less than
vii. The salary that 30% of employees earn more than

Interpret

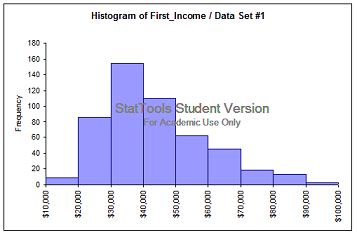
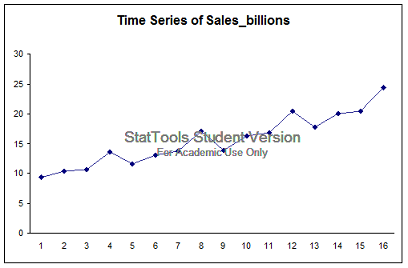
Q5) Examine the graphs shown below. What do you learn from these graphs? What knowledge or information do they communicate? For the histogram, what can you tell us about the distribution of the variable First_Income? For the time-series graph, what can you say about trend and seasonal characteristics of the data? It might help if you pretend you are summarizing the results in a few sentences for your boss. Please type your answers in the text boxes provided.

a) Graph 1 (from data set Q1)

923_graph.png

b) Graph 2 (this graph shows quarterly sales dollars in billions for Wal-Mart over a 4 year period).

67_sales.png

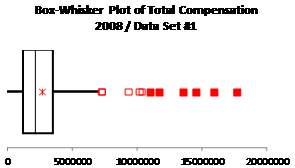
Q6) Interpret the following. What do you learn? What conclusions can you draw? Don't forget to write your answers in the spreadsheet on the Q6 worksheet.

The Wall Street Journal CEO Compensation Study analyzed CEO pay for many US companies with fiscal year 2008 revenue of at least $5 billion. Some summary measures and as a boxplot of the distribution of compensation are shown below. What can you conclude from this analysis?


Total Compensation 2008

One Variable Summary

Data Set #1

Mean

$2,704,943.04

Std. Dev.

$2,226,295.52

Median

$2,149,200.00

Minimum

$0.00

Maximum

$17,649,500.00

Range

$17,649,500.00

Count

381

1st Quartile

$1,217,600.00

3rd Quartile

$3,526,300.00

Interquartile Range

$2,308,700.00

1.00%

$0.00

2.50%

$296,900.00

5.00%

$737,500.00

95.00%

$5,963,100.00

97.50%

$7,300,000.00

99.00%

$13,535,000.00


197_box.png

Attachment:- copy_of_chapter_2_homework2.rar

Reference no: EM131207932

Questions Cloud

Analyze the required elements of a communication plan : Analyze the required elements of a communication plan. Describe the different organizational structures as it relates to project management (i.e., functional, project-based, matrix).
Personal definition of the spirit of capitalism : What is your personal definition of The Spirit of Capitalism? What religion is most popular in governments with free capitalism? List five (5) characteristics of the Protestant work ethic.
Determine the simons net unearned income : Determine the Simon's net unearned income. - Determine the Simon's allocable parental tax.- Determine the Simon's total Federal income tax liability.
How does diversity help us in this process : Having the right organization structure in place helps us to have a successful plan. Why is it important to have the right balance between owners, leaders and managers within our organization.
Is this cross-sectional or time series data : The Wall Street Journal CEO Compensation Study analyzed CEO pay for many US companies with fiscal year 2008 revenue of at least $5 billion. Some summary measures and as a boxplot of the distribution of compensation are shown below. What can you ..
Under modern scrutiny : Write a 3-4 page paper that reviews Max Weber's theories and arguments to explain a recent social event (i.e., Occupy movement, local high-profile event). Does his theory hold up under modern scrutiny? Why or why not? Support your response.
Explain how you can use presentation skills and knowledge : Explain how you can use presentation skills and knowledge of yourself and your goals, intentions, and current actions and activities to better address your coursework and your current job or career.
Compute his taxable income and the tax liability : Asok's AGI for 2015 is $133,050.  -Compute his taxable income, the tax liability, and the tax savings from the alternative tax on net capital gain.
Example and practice sections of balanced scorecard : Review the Example and Practice sections of the Balanced Scorecard Module to practice reading and evaluating the information it presents.

Reviews

Write a Review

Business Management Questions & Answers

  Mitigate the risks of overseas investment

1. Did the government of the investor play an active role in the transaction? 2. What measures did the investor employ to mitigate the risks of overseas investment?

  Find the density of the co

Find the density of the CO under the new conditions. Express your answer to two significant figures and include the appropriate units.

  Illustrate what is the probability an advertising industry

A study of 200 advertising industries revealed their income after taxes. Illustrate what is the probability an advertising industry selected at random has under $1 million in income after taxes?

  Should shareholders of corporation decide to file a lawsuit

Dscuss whether you believe business judgment rule would apply to each of the corporate directors and president discussed within the scenario. Should shareholders of the corporation decide to file a lawsuit. Explain why.

  The purpose of this brief discussion assignment

I. Introduction: The purpose of this brief discussion assignment is to help you further develop your understanding of your employer's current or potential strengths. Because this course is interested in how human behavior can be understood and levera..

  Applicable legal restraints on business

The objective of this project is to familiarize the student with applicable legal restraints on business.  It is important that each prospective business manager be able to locate applicable law regulating the business activity

  What are the primary exports and imports

What is the GDP of the country? What is its per capita income? What are the primary exports and imports? Who are the country's primary trading partners?

  Illustrate what happens these businesses not keeping track

Illustrate what happens when these businesses are not keeping track of where they are losing the consumers.

  Organizational change: a conceptual approach

Read the article titled "Multilevel Readiness to Organizational Change: A Conceptual Approach". Give your opinion on which two (2) means of diagnosing change are most relevant to today's organizations. What is meant by the term "readiness"?

  What would you do to better motivate people

Submit a paper outlining the processes or programs used to motivate employees in nestle Include the policies or practices (formal or informal) that leaders use to increase levels of performance. If you were a manager, what would you do to better m..

  Create arguments for also against the legislation

Describe who the stakeholders are who will be affected by such legislation. Create arguments for also against the legislation.

  Relative demand in a diagram with the relative price

Graph the relative demand in a diagram with the relative price of fish (PF/PM) on the vertical axis and the relative quantity of fish (QF/QM) on the horizontal axis.

Free Assignment Quote

Assured A++ Grade

Get guaranteed satisfaction & time on delivery in every assignment order you paid with us! We ensure premium quality solution document along with free turntin report!

All rights reserved! Copyrights ©2019-2020 ExpertsMind IT Educational Pvt Ltd