Reference no: EM131398
Q1. Which of the following best describes the research question for this study?
a. What are the reasons people drive while talking on a mobile phone?
b. How is driving while talking on a mobile phone associated with the risk of a car accident?
c. What are the costs of mobile-phone related motor vehicle accidents?
d. How effective are hands-free mobile telephones in reducing the annual incidence of car accidents?
Q2. Which of the following best describes the study design used in this scenario?
a. Longitudinal cohort study
b. Cross-sectional descriptive study
c. Case-control study
d. Non-randomised experimental study
e. Pre-post study
Q3. What level of evidence does this study design represent?
b. Two
c. Three
d. Four
e. Five
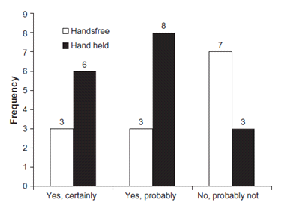
Figure 1
The researchers asked the 1997 and 2007 survey respondents (who were at fault of causing the accident) if they thought they could have avoided the crash if they had not been talking on the mobile phone while driving. The results from available data are presented in Figure 1.
Q4. Using the information from Fig.1, answer the following questions:
(i) What percentage of respondents (who provided usable data) believed that they could have certainly avoided the crash if they had not being driving while talking on a hand-held mobile phone?
(ii) What percentage of respondents (who provided usable data) believed that they could probably have avoided the crash if they had not being driving while talking on a hands-free mobile phone?
(iii) What percentage of respondents (who provided usable data) believed that they probably could not have avoided the crash if they had not being driving while talking on any type of mobile phone?