Reference no: EM131384302
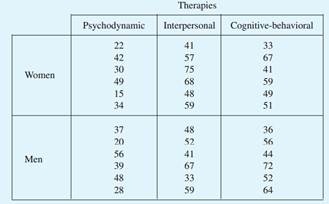
For the data on the effectiveness of therapies and gender in given problem, plot the cell means using a line graph. Compute df, MS, and F values. Arrange these in a summary table and note the appropriate critical values. Tell what the analysis shows.
Problem
Clinical depression occurs in about 15 percent of the population. Many treatments are available. The data that follow are based on Hollon, Thrase, and Markowitz's study (2002) comparing:
(1) psychodynamic therapy, which uses free association and dream analysis to explore unconscious conflicts from childhood,
(2) interpersonal therapy, which progresses through a three-stage treatment that alters the patient's response to recent life events, and
(3) cognitive-behavioral therapy, which focuses on changing the client's thought and behavior patterns.
The second factor in this data set is gender. The numbers are improvement scores for the 36 individuals receiving therapy.
a. Identify the design using R × C notation.
b. Identify the independent variables, their levels, and the dependent variable.
c. Calculate SStot, SScells, SStherapy, SSgender, SSAB, and SSerror.

|
Name the independent variables and their levels
: Identify the design using R × C notation.- Name the independent variables, their levels, and the dependent variable.- Calculate SStot, SScells, SSgender, SShandedness, SSAB, and SSerror.
|
|
What would your biggest challenge be if you were expatriate
: Analyze two (2) of the major hardships facing expatriates on their return home after a lengthy assignment. What would your biggest challenge be if you were an expatriate?
|
|
What is the total rms level of the noise
: Determine the signal-to-noise ratio of the channel. (c) What is the root spectral density of the noise over the 2-kHz Nyquist interval
|
|
What is the spurious free dynamic range asscoiated
: If a device has a 0-dB carrier signal level specifi cation of 1.5 V RMS and the largest spur in the frequency domain is 0.95 mV RMS, what is the spurious free dynamic range asscoiated with this device?
|
|
Identify the independent variables and their levels
: Identify the design using R × C notation.- Identify the independent variables, their levels, and the dependent variable.- Calculate SStot, SScells, SStherapy, SSgender, SSAB, and SSerror.
|
|
Describe what you can learn from an organizational
: Assume that you have been hired by U-Haul to conduct a needs analysis. How can the needs analysis process and each level of needs analysis help you understand the safety problem and whether training should be part of the solution to solve it? Desc..
|
|
Compute df and ms and f values
: For the data on state-dependent memory in given problem, plot the cell means using a bar graph. Compute df, MS, and F values.
|
|
The candidate is to write and present a report
: The candidate is to write and present a report on the marketing mix based on Electronic Product from Apple Company.
|
|
Write an interpretation of analysis of the data
: For the data on state-dependent memory in problem 2, plot the cell means using a bar graph. Compute df, MS, and F values. Arrange these in a summary table and note the appropriate critical values.
|