Reference no: EM131149796
ASSIGNMENT: INTERPRETING PEARSON CORRELATION AND SIMPLE LINEAR REGRESSION
Biostat Assignments provide opportunities for you to develop hypotheses, to calculate statistics, and to interpret output and summary tables. Each assignment focuses on one or two of the statistical concepts discussed in the weekly readings. BiostatAssignment 4 focuses on the interpretation of the Pearson correlation and a simple linear regression. There are 10 questions below; each question is worth 1 point. Submit your completed assignment through the linkprovided on Blackboard.
PART ONE: PEARSON CORRELATION
Suppose that we are interested in the strength of the association between dietary sodium intake (the independent variable (X)) and mean arterial blood pressure (the dependent variable (Y)). We conduct a small pilot study, measuring sodium intake and blood pressure on 15 persons. We calculate a mean dietary sodium of 14.993gm/day and a mean arterial pressure of 107.800mmHg. The data are displayed in the table below:
|
Subject
|
X
|
Y
|
X - X-bar
|
(X - X-bar)2
|
(Y-Y-bar)
|
(Y-Y-bar)2
|
(X-X-bar)(Y-Ybar) |
|
101
|
11.80
|
78.00
|
-3.19
|
10.20
|
-29.80
|
888.04
|
95.16 |
|
102
|
7.00
|
72.00
|
-7.99
|
63.89
|
-35.80
|
1,281.64 |
286.16 |
|
103
|
16.90
|
101.00
|
1.91
|
3.64
|
-6.80
|
46.24
|
-12.7 |
|
104
|
5.20
|
97.00
|
-9.79
|
95.91
|
-10.80
|
116.64
|
105.77 |
|
105
|
5.40
|
62.00
|
-9.59
|
92.03
|
-45.80
|
2,097.64 |
439.37 |
|
106
|
5.50
|
115.00
|
-9.49
|
90.12
|
7.20
|
51.84
|
-68.35 |
|
107
|
23.30
|
140.00
|
8.31
|
69.00
|
32.20
|
1,036.84 |
267.47 |
|
108
|
22.00
|
144.00
|
7.01
|
49.09
|
36.20
|
1,310.44 |
253.64 |
|
109
|
9.00
|
74.00
|
-5.99
|
35.92
|
-33.80
|
1,142.44 |
202.57 |
|
110
|
10.50
|
108.00
|
-4.49
|
20.19
|
0.20
|
0.04 |
-0.90 |
|
111
|
28.00
|
124.00
|
13.01
|
169.17
|
16.20
|
262.44
|
210.71 |
|
112
|
28.90
|
164.00
|
13.91
|
193.40
|
56.20
|
3,158.44 |
781.55 |
|
113
|
29.20
|
130.00
|
14.21
|
201.83
|
22.20
|
492.84
|
315.39 |
|
114
|
8.40
|
93.00
|
-6.59
|
43.47
|
-14.80
|
219.04
|
97.58 |
|
115
|
13.80
|
115.00
|
-1.19
|
1.42
|
7.20
|
51.84
|
-8.S9 |
|
|
|
|
|
1,139.29
|
|
12,156.40 |
2,964.58
|
From Dawson and Trapp, we know that the formula for the Pearson product moment correlation coefficientis:
r = Σ(X - X-)(Y - Y-)/(√Σ(X - X-)2Σ(Y-Y-2))
1) Using the information in the table provided, calculate correlation coefficient (r) and show your work.
2) Interpret the size of r.
We enroll an additional 15 subjects (total sample size = 30) and measure their dietary sodium intake (NA) and mean arterial blood pressure (DBP). We analyze the data using SAS's CORR procedure and observe the results shown in Table 1 (see page 6). Based on those findings, answer the following questions.
3) Identify the dependent variable and the independent or explanatory variable in this study. Also, state the Null and Alternative hypotheses.
4) Report the correlation coefficient and P-value that should be used to test the Null hypothesis. Based on that information, what conclusion can you make about the Null hypothesis? (i.e. Reject or Fail to Reject the Null). In your response, include your interpretation of the Pearson correlation coefficient.
PART TWO: SIMPLE LINEAR REGRESSION
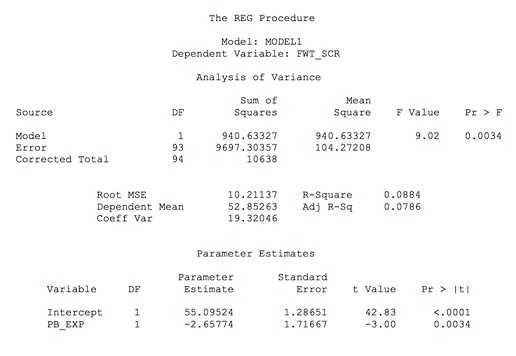
Suppose that we are interested in the neurological effect of lead exposure (micrograms per cubic meter of air (µg/m3)) on children. We collect data on the average hourly airborne concentration of lead (PB_EXP) and finger-wrist tapping scores (FWT_SCR) for 95children. To test the null hypotheses that knowing the level of lead exposure does not help estimate finger-wrist tapping scores, we analyze the data using SAS's REG procedure. The results are shown in Table 2 (see page 7). Based on those findings, answer the following questions.
1) Identify the dependent variable and the independent or explanatory variable(s) in this study. Also, state the Null and Alternative hypotheses.
2) Report the test statistic and P-value that should be used to test the Omnibus (or Overall) Null hypothesis. What is your conclusion about the Omnibus Null hypothesis?
3) Report and interpret the parameter estimate for PB_EXP from the SAS output.
4) Using the regression equation (Y = a + bX), calculate the predicted finger-wrist tapping score for a child who has been exposed to 7.5µg/m3of lead per hour.
5) What is your interpretation of the R-square value?
6) Write a one-paragraph summary of your interpretation of these findings. Towards the end of your summary, include a discussion about the generalizability of these results. What do the findings mean from clinical perspective?
Table 1: Output for Part One
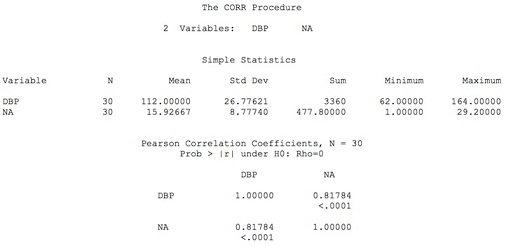
Table 2: Output for Part Two