Reference no: EM132389456
Assignment
1. The value of R2 in a multiple regression cannot be high if the estimates of the regression slope cofficients are shown to be insignificantly different from zero on the basis of t tests of significance, since in that case most of the variation in y must be unexplained, and hence the value of R2 must be low. True, false, or uncertain. Explain.
2. Suppose that average worker productivity at manufacturing firms ( avgprod) depends on two factors: average hours of training (avgtrain) and average worker ability (avgabil)
avgprod = β0 + β1avgtrain + β2avgabil + u
Assume that this equation satisfies the Gauss-Markov assumptions.
If grants for training programs have been given to firms whose workers have less than average ability, so that avgtrain and avgabil are negatively correlated, what is the likely bias in β1˜, obtained from the simple regression of avgprod on avgtrain?
3. Consider a regression equation that relates infant birth weight to cigarette smoking and family income
(bwght)^ = βˆ0 + βˆ1cigs + βˆ2ƒaminc,
where
bwght = child birth weight, in ounces
cigs = number of cigarettes smoked by the mother while pregnant, per day
ƒaminc = annual family income, in thousands of dollars
Estimating the equation yields:
(bwght)^ = 116.97(1.05)- .463(.092) cigs + .093(.029) f aminc,
where standard errors are in parantheses below the estimated coefficients.
(a) State precisely the estimated effect of cigarettes on birth weight based on the results from the model above.
(b) Suppose that instead of ounces, birth weight were measured in pounds. Can you use the results from the regression equation above to find the effect of an additional cigarette on birth weight in pounds (lbs.)? (Hint : 1 lb = 16 ounces)
(c) Now suppose we wanted to find the effect of an additional pack of cigarettes on birthweight (in ounces again). A pack contains 20 cigarettes. Use the results from the estimated equation above to find the effect of an additional pack of cigarettes on birthweight (in ounces).
(d) How would the coefficient on family income change if family income were mea- sured in terms of dollars, rather than in terms of thousands of dollars (e.g., suppose you defined a new variable ƒ amincdol = 1000 × ƒ aminc, what would be the coefficient on ƒ amincdol?)
(e) When switching from ounces to pounds in our measurement of birthweight- or from thousands of dollars to dollars in our measurement of family income-will the t statistics associated with our esimated coefficients or the R-squared of the regression change?
4. Suppose we we want to estimate the model:
yi = β0 + β1xi1 + β2xi2 + β3xi2 + . . . + βkxik, for i = 1, 2, . . . , n
We can write this model in matrix notation as
y(n×1) = X(n×(k+1)) β(k+1)×1 + u(n×1)
(a) What assumptions are required for unbiasedness of OLS?
(b) In matrix notation, demonstrate the unbiasedness of the ( k x 1) OLS estimator βˆ using the assumption that:
Xj((k+1)×n) u(nx1) = o ((k+1)×1)
For each step, state any necessary assumptions.
(c) Now derive the formula for the variance of βˆ using matrix notation.
|
Obs
|
GPA
|
ACT
|
(GPA)^
|
Residuals
|
|
1
|
3
|
21
|
|
|
|
2
|
3.4
|
24
|
|
3
|
3
|
26
|
|
4
|
3.5
|
27
|
|
5
|
3.6
|
28
|
|
6
|
3
|
25
|
|
7
|
2.7
|
25
|
|
8
|
2.7
|
22
|
(a) Compute the variance of ACT.
(b) Estimate the relationship between ttP A and ACT using OLS, obtaining the intercept and slope estimates in the equatin:
(tPA)^ = βˆ0 + βˆ1ACT
(c) Calculate the predicted values, (tPA)^, and residuals, uˆ, for each observation, and enter them in the table above.
(d) Compute the SST (i.e., total sum of squares, or the total variance in the de- pendent variable). What proportion of the variation in ttP A does ACT explain?
5. Below are the results from two regressions of wage on education, experience, tenure, and age.
Unrestricted Model:
log^(wage) = 5.48 + .075 educ + .013 tenure + .018 exper - .0001exper2
SSR = 140, SST = 165, R2 = .155, n = 935
where SSR is the sum of squared residuals and SST is the total of sum of squares: Σn i-1= (yi - y¯).
Restricted Model:
log^(wage) = 5.83(.006) + .061(.006) educ + .016(.003) tenure
SSR = 143, SST = 165, R2 = .136, n = 935
Let tcα and denote the one-tailed critical values from the t distribution at significance level, α
(hint: you can deduce the two-tailed values from these):
tc α=.05 = 1.65
tc α=.025 = 1.96,
Use the following critial value of the F distribution for any F -tests in this problem: F c α=0.5 =3.
For the questions below, specify what test that you would conduct, state the null and alternative hypotheses, and compute the relevant test statistic.
If you do not have all the information you need to compute the test statistic, indicate what information is missing. You should still write out the formula for the test statistic.
(a) Is there evidence at the 5% level that the effect of experience on log(wage) is quadratic?
(b) Test at the 5% significance level whether exper and expersq are individually significant (i.e., different from zero). Then test whether they are jointly significant (again at the 5% significance level).
(c) Test whether the effect of experience is equal to the effect of tenure in the first (unrestricted) model (i.e., test only whether the effect of exper and tenure are equal; ingore exper2).
(d) Is there evidence at the 5% significance level that tenure in the first (unre- stricted) model is strictly positive?
(e) In the first model, what is the effect of 5 additional years of experience on log(wage)?
(f) Based just on the signs of the estimated coefficients on exper and expersq (and ignoring for the moment whether or not they are statistically different from zero), how would you characterize the effect of experience on log(wage) over the sample distribution of exper?
(i)initially positive but diminishing
(ii)initially positive but increasing
(iii)initially negative and diminishing (becoming more negative)
(iv)initially negative and increasing (becoming less negative)
(v)constant
6. Use the following table to answer the questions below. Note that each column of the table represents a separate regression model of wage on different subsets of explanatory variables that include education, experience, tenure, and IQ. In each model, the dependent variable is wage (not log(wage)).
Blank cells in a column indicate that the given variable was omitted from that particular model.
For example, the first column shows the results of a model of wage on educ; the second column shows the results of a model of wage on educ and experience, etc. Observations (N ) and R2 of each model are reported at the bottom.
|
(1)
|
(2)
|
(3)
|
(4)
|
(5)
|
|
wage
|
wage
|
wage
|
wage
|
wage
|
|
-----------------------------------------------------------------------------
|
|
educ
|
60.21
|
76.22
|
74.41
|
57.20
|
42.06
|
|
|
(5.695)
|
(6.297)
|
(6.287)
|
(7.033)
|
(6.550)
|
|
exper
|
|
17.64
|
14.89
|
14.98
|
|
|
|
|
(3.162)
|
(3.253)
|
(3.209)
|
|
|
tenure
|
|
|
8.257
|
7.360
|
|
|
|
|
|
(2.498)
|
(2.470)
|
|
|
IQ
|
|
|
|
4.873
|
5.138
|
|
|
|
|
|
(0.939)
|
(0.956)
|
|
_cons
|
147.0
|
-272.5
|
-276.2
|
-532.4
|
-128.9
|
|
|
(77.71)
|
(107.3)
|
(106.7)
|
(116.2)
|
(92.18)
|
|
-----------------------------------------------------------------------------
|
|
N
|
935
|
935
|
935
|
935
|
935
|
|
R-sq
|
0.107
|
0.136
|
0.146
|
0.170
|
0.134
|
|
-----------------------------------------------------------------------------
|
Standard errors in parentheses
(a) Use the formula for omitted variables bias to explain why we see the cofficient on educ increase when we add exper to the model.
(b) Explain why we see a large decrease in the magnitude of the estimated cofficient on educ, βˆeduc, when we add IQ (a measure of ability or intelligence) to the model (compare the effect of educ in columns (3) and (4)).
(c) Explain why the standard error of the estimate of more variables to the model.
βˆeduc gets larger as we add
(d) Suppose someone had only run the regression equations shown in columns (1) and (4) and concluded that omitting IQ from the regression of wage on education induced only a small bias, pointing to the decline in the coefficient on wage from 60.21 to 57.20. Is that a fair comparison? What is a better comparision to gauge the bias due to omitting IQ from the simple regression model?
(e) Suppose that you produce a histogram of the residuals from the model in col- umn (4) that show that the distribution of the residuals does not appear to be normally distributed (i.e., follow a bell-shaped distribution). A fellow student claims that because of this, any hypothesis testing would be invalid. How would you respond? Do you have any suggestions to address the apparent violation of the normality assumption?
(f) The variable wage measures total monthly earnings, in dollars. Suppose we had another variable, hours, that measured hours worked per month, and added that to
our regression model. How would the ceteris paribus interpretation of the cofficient on education, βˆeduc, change in this new model relative to the model that omitted hours?
7. Use the diagram to answer the following questions. Each circle represents the total variation in the respective variable.
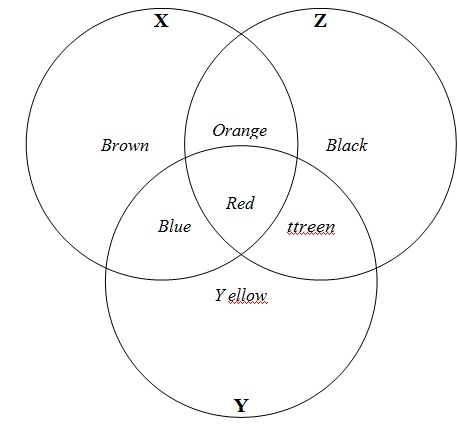
(a) Indicate the variation used in OLS regression to estimate model:
βˆx in the following
y = β0 + βxx + u
(b) Indicate the variation used in OLS to estimate βˆx in the following model:
y = β0 + βxx + βzz + u
(c) What variation represents σ2, the error variance of the regression, in the model in part (a)?
(d) What happens to the variation represented by the red area in the OLS regression in part (b)? Why?
(e) What area(s) represent σ2, the error variance of the regression, in the model in part (b)?
(f) What area(s) represent the SSE (or the explain variation) from the regression in part (b)?
(g) What area represents the the error variance, or unexplained variation, of the following regression:
x = γ0 + γzz + η
where η is the error term.
(h) The area representing the error variance from the regression in part (g) also represents the residuals of the regression of x on z. What area represents the information used for the slope estimate when you regress y on the residuals from the regression of x on z, ηˆ? What area is this equivalent to? (Hint: Think about the "partialling out" result.)