Reference no: EM131021207
1. Use the following to answer questions a-e:
Identify whether each of the following samples is a possible bootstrap sample from this original sample 20, 24, 19, 23, 18
a. 24, 18, 23
A) Possible B) Not Possible
b. 24, 19, 24, 20, 23
A) Possible B) Not Possible
c. 20, 24, 21, 19, 11
A) Possible B) Not Possible
2. Use the following to answer questions a-c:
According to U.S. Census data, 71.6% of American are age 21 and over. The provided figure shows possible sampling distributions for the properties of a sample age 21 and over, for samples of size n = 50, n= 125, and n =250.
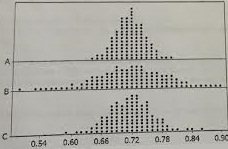
a. Sample A: n = ____
b. Sample B: n = ____
c. Sample C: n = ____
3. In 2010, the centers for disease control and prevention estimated 9.4 % of children under the age of 18 had asthma. They reported and standard error to be 0.35%. Assuming that the sampling distribution is symmetric and bell-shaped, find 95 % confidence interval.
4. Use the following to answer questions a-e:
A sample of 148 college students reports sleeping an average of 6.85 hours of weeknight- with a margin a error of 0.35 hours. Based on this information, identify each of the following as plausible or not for the average amount of sleep college student get on weeknights.
a. 6.6 hours
A) Plausible B) Not Plausible
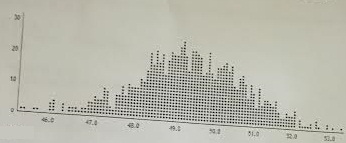
b. 7.5 hours
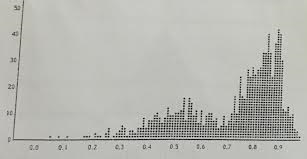
A) Plausible B) Not Plausible
c. 8 hours
A) Plausible B) Not Plausible
5. Describing the confidence level (say, from 95% to 85 %) will cause the width of a typical confidence interval to
A) increase b) decrease C) remain the same
6. Percentiles of the bootstrap distribution are provided. Use the percentiles to report a 95% confidence interval for the parameter.
| 1% |
2.50% |
5% |
10% |
25% |
50% |
75% |
90% |
95% |
97.50% |
| 6.174 |
6.322 |
6.438 |
6.593 |
6.866 |
7.17 |
7.481 |
7.78 |
7.947 |
8.012 |
Use the following to answer questions 7-9:
Suppose the a 95% confidence interval for the slope of a regression line based on a sample of size n- 100 and the percentiles of the slopes for 1000 bootstrap sample goes from 2.50 to 2.80. For each change described indicate which of the three confidence intervals would be the most likely result.
7. Decrease the sample size to n = 60.
A) 2.53 to 2.77 (narrower) B) 2.50 to 2.80 (the same) C) 2.46 to 2.83 (wider)
8. Increase the number of bootstrap samples to 5,000
A) 2.53 to 2.77 (narrower) B) 2.50 to 2.80 (the same) C) 2.46 to 2.84 (wider)
9. 1ncreaSe Mc number of bootstrap samples to 5,000
A) 2.53 to 2.77 (narrower) 8) 2.50 to 230 (the same) C) 2.36 to 224 (Min) Arty
10. Suppose that a student collects pulse rates from a random sample of 200 students at her college and finds a 90% confidence interval goes from 65.5 to 71.8 beats per minute. Is the following statement an appropriate interpretation of this interval? If not, explain why not.
"90% of the student at my college have mean pulse rate between 65.5 and 71.8 beats per minute."
Use the following to answer questions 11-15:
Suppose we are interested in comparing the proportion of male students who smoke to the proportion of female students who smoke. We have a random sample of 150 students (60 males and 90 females) that includes two variable: Smoke = "yes" or "no" and Gender = "female" or "male". The two-way table below summaries the results.
|
Smoke = yes |
Smoke = no |
Sample size |
| Gender = M |
9 |
51 |
60 |
| Gender = F |
9 |
81 |
90 |
11. If the parameter of interest is the difference in properties pm = pf where pm and pf represent the proportion of smokers in each gender, find a point estimate for this difference in proportioes based on the data in the table report your answer with two decimal places.
12. Describe how to use the data to construct a bootstrap distribution. What value should be recorded for each of the bootstrap samples.
13. Use technology to construct a bootstrap distribution with at least 1,000 samples and estimate the standard error.
14. Use the estimate of the standard error to construct a 95% confidence interval for the difference in the proportion of smokers between male and female students pm-pf. Round the margin of error to three decimal places. Provide an interpretation of the interval in the context of this data situation.
15. Use percentiles of your bootstrap distribution to provide a 98% confidence interval for the difference in the proportion of smokers between male and female students. State which percentiles you are using.
16. A sample of size 46 with a mean of 13.6 is to be used to construct a confidence interval for μ. A bootstrap distribution based on 1,000 samples is created. Where will the bootstrap distribution be centered?
A) 46 B) 13.6 c) μ D) 1,000
17. True or false. In a dotplot of a bootstrap distribution, the number of dots should match the size of the original sample.
18. True or false. A bootstrap distribution will be centered at the value of the original statistic.
19. A bootstrap distribution based on 1000 bootstrap samples is provided. Use the distribution to estimate a 99% confidence interval for the population mean. Explain how you arrived at your answer.
20. Her samples consists of 20 porcupines. A bootstrap distribution for the correlation between body mass and length (based on 1000 samples) is provided. Would it be appropriate to use this bootstrap distribution to estimate a 95 % confidence interval for the correlation between body mass and length of porcupines? Explain briefly.