Reference no: EM132369792
Dataset Questions
1. How many variables are in the dataset?
2. How many observations are in the dataset?
3. Which variables are categorical and which are quantitative?
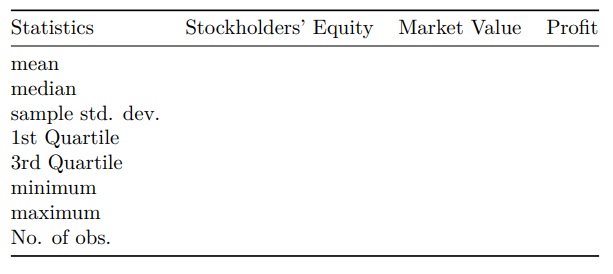
4. Use Excel to find: number of observations, mean, median, 1st and 3rd quartiles, sample standard deviation, minimum and maximum for variables: Stockholders’ Equity, Market Value and Profit.
5. Company Type
• Using a PivotTable: Prepare the percentage frequency distribution of Company Type. No need to copy and paste the table to the homework. But you need it for the next step.
• Prepare a Pie Chart of the Company Type. Copy and Paste it here.
• Which is the most frequent Company type in the dataset?
6. Company Type and Stockholders’ Equity
• Using a PivotTable: Prepare a cross tabulation of Company Type (rows) and Stockholders’ Equity (columns). min= 0, max=6000, by=1000 No need to copy and paste the table to the homework. But you need it for the next step.
• Prepare a 100% Stacked Bar Chart of Company Type (horizontal axis category) and Stockholders’ Equity (stacked categories). Copy and Paste it here.
• Which Company Type has the highest Stockholders’ Equity?
7. Market Value and Stockholders’ Equity.
• Do a Scatter Plot of Market Value (vertical axis) and Stockholder’s Equity (horizontal axis). Add a linear trend line. Copy and Paste it here.
• Calculate the correlation between the Market Value and Stockholder’s Equity?
• Comment on the relationship. Is it positive or negative? Strong or weak? Do companies with higher Market Value also have higher Stockholder’s equity?
8. Draw a histogram for Profit using a PivotTable. Group Settings: min= 0, max=1200, by=100.
• Comment on the shape of the histogram. Is it symmetric or skewed left/right?
Mean and standard Deviation
1. Find the formula for the mean. Write the formula here; by hand.
2. Find the formula for the sample standard deviation. Write the formula here; by hand.
3. Calculate, by hand, the mean and sample-standard-deviation if: n = 3, x1 = 4, x2 = 6, x3 = 14.
4. Use the command below to generate 3 random numbers. Calculate their mean and sample-standarddeviation in (i) Excel and (ii) by hand.
• Excel copy and paste (or type) this function into Excel to generate a random number between 1 and 20, do this in three cells to get three random numbers.
=RANDBETWEEN(1,20)
• Calculate the mean and standard deviation in Excel using the functions below.
=AVERAGE(data)
=STDEV.S(data)
• Write the three random numbers:
• Calculate the mean and standard deviation here, by hand. Show your calculations.
Drawing many sample means from the same population
There are ten students in a class. Consider these 10 students to be the population of the class. Let xi represent the test score for student i, test scores are: x1 = 1, x2 = 2, x3 = 3, x4 = 4, x5 = 5, x6 = 6, x7 = 7, x8 = 8, x9 = 9, x10 = 10. A researcher is interested in the mean test score for the class. But he/she can only observe a random sample of 3 students’ scores.
1. What is the population mean/average test score? Write your answer here.
2. Draw three random numbers using the code below. This is one sample with n = 3. Write down the three random numbers. Calculate the sample mean.
=RANDBETWEEN(1,10)
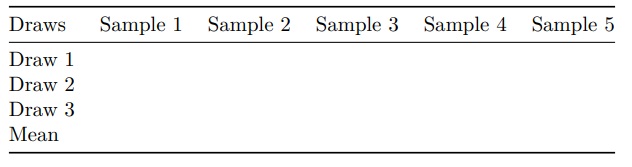
3. Draw 5 sets of sample scores (imagine that 5 researchers came and each took a sample). Do this by repeating the steps from question 2 above five times in five different columns. Each column constitutes a sample of 3 observations. So, you have 5 samples with n=3 each.
• For each sample (each column), write down the sample draws and calculate the sample means (using Excel).
• We know the true population mean, how do the sample means compare to the population mean? If each research only sees their own sample mean and tries to infer from their sample the population mean, will they draw different conclusions?
Covariance and Correlation
1. Look up the formula for the sample covariance. Write the formula here; by hand.
2. Look up the formula for the sample correlation coefficient. Write the formula here; by hand.
3. What are the largest and smallest possible values for the sample correlation coefficient? This is true for any correlation coefficient and has nothing to do with actual data.
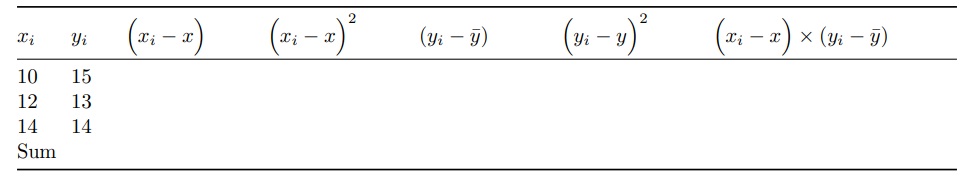
4. Calculate, by hand, the sample-covariance and sample-correlation-coefficient:
• n = 3
• x1 = 10, x2 = 12, and x3 = 14
• y1 = 15, y2 = 13, and y3 = 14
• This is best done by filling something similar to the following table to stay organized.
5. Input the numbers into Excel and confirm your answer using the function below. (No need to answer anything here, just make sure you got the right answer.)
=CORREL(data1, data2)
6. Draw a scatterplot of the variables X and Y. Add a fitted line (linear trend line).
7. Use the correlation coefficient and/or scatterplot to comment, in a complete sentence, about the relationship between X and Y. Is it positive/negative and strong/weak?
Attachment:- Companys List.rar