Graphical technique to compare the divorce rates

Assignment Help Basic Statistics
Reference no: EM13249719

Question 1

The Australian divorce rate has been steadily increasing over the years until late 1990s. However, data suggests that the rate has fallen in the most recent years. Age specific Australian divorce rates (in percentages) of male and female for few years between 1992 and 2012 are given in the attached Excel file (GB513Assignment-Q1.xls).

Using the information given in the data file, complete following tasks.

a. Use a graphical technique to compare the divorce rates in 1992, 2008 and 2012 broken down by age for Australian Male. Describe your graph.

b. Use a graphical technique to compare the divorce rates in 1992, 2008 and 2012 broken down by age for Australian Female. Describe your graph.

c. Compare your observations in parts (a) and (b) above to comment on the differences in divorce rate for male and female over the years.

Question 2

The Australian Bureau of Statistics recently released figures on petrol usage. Following are the 15 leading cities in 2012.

840_Graphical technique to compare the divorce rates.png

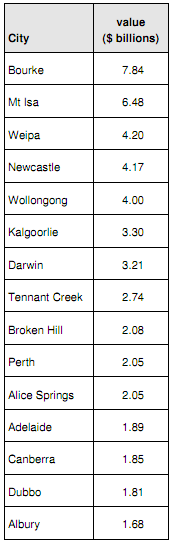
(a) Using the Data Analysis Tool in Excel, calculate the descriptive statistics.

(b) Briefly explain what each of the metrics in the summary statistics means.

(c) Comment on the figures in the report. What are they telling you about this data set? Is it symmetrical, flat, skewed, does it have outliers, and so on?

Question 3

A popular media poll revealed that 44% of Australian adults in the 18-34 years category think that ‘Made in Australia' ads boost sales. A different interactive poll showed that 78% of Australian adults in the 18-34 years category use social media. Suppose that 85% of Australian adults in the 18-34 years category think that ‘Made in Australia' ads boost sales or use social media. If an Australian adult in the 18-34 years category is randomly selected:

(a) What is the probability that the person thinks that ‘Made in Australia' ads boost sales and uses social media?

(b) What is the probability that the person thinks that ‘Made in Australia' ads boost sales given that the person does not use social media?

Please be sure to include all workings with your answers.

Question 4

The proportion of credit-card holders who pay their bill in full each month is 20%; the other 80% make only a partial or no payment.

(a) In a random sample of 17 customers, what is the probability that:

i. 4 customers pay their bill in full?
ii. More than 4 customers pay their bill in full?
(b) What is the expected number of customers who credit card bill in full?
(c) What is the standard deviation?

Question 5

The number of calls received by a phone operator at an emergency department between 10-11am has a Poisson distribution with a mean of 12.

(a) Find the probability that the operator received at least 5 calls during the following period.
I. 10-11am
II. 10-10.30am
III. 10-10.15am

(b) What is the probability that fever than 4 calls were received between 10 & 10.30am?

(c) What is the probability that 6 or more calls were received between 10 & 10.30am?

Question 6

According to a recent research report, the average monthly household mobile phone bill is $73. Suppose monthly household mobile phone bills are normally distributed with a standard deviation of $11.35.

(a) What is the probability that a randomly selected monthly mobile phone bill is no more than $55?

(b) What is the probability that a randomly selected monthly mobile phone bill is more than $100?

(c) What is the probability that a randomly selected monthly mobile phone bill is between $80 and $90?

(d) What is the probability that the average mobile phone bill of randomly selected sample of 25 bills is between $71 and $80?

Please be sure to include all workings with your answers.

Question 7

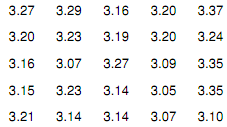
Suppose a study reports that the average price for a kilogram of grapes is $3.16. You believe that the price is higher in your area of the country. You decide to test this claim by randomly calling grocery stores. Your random survey of 25 stores produces the following prices (all in $). Assume grape prices for a region are normally distributed. Does the data you obtained provide enough evidence to support your belief?

Conduct a hypothesis test at 1% level of significance and clearly state your conclusion.

916_Graphical technique to compare the divorce rates1.png

Reference no: EM13249719

Questions Cloud

Explain molten mixture of potassium and hydrogen fluoride : when a current of 308 mA is used for 8h, what volume of fluorine gas at 298 K and 1 atm can be produced from a molten mixture of potassium and hydrogen fluoride
Is it possible to substitute the pmos for the nmos : How can you design a high gain (at least 20dB) operational amplifier with only pmos transistors In most designs, they include both nmos and pmos transistors. Is it possible to substitute the pmos for the nmos
Find the magnitude of electric force between two charges : Two point charges are separated by d= 10 cm and have charges of q1= +2(mu)C and q2= -2 (mu)C, respectively, What is the magnitude of the electric force between the two charges
Major drawback to air traffic control automation : Analyze and evaluate one major drawback to air traffic control automation. Then discuss the degradation in operational safety that could result from this drawback.
Graphical technique to compare the divorce rates : Use a graphical technique to compare the divorce rates in 1992, 2008 and 2012 broken down by age for Australian Male. Describe your graph.
Identify a foreign mne that has undertaken inbound : Identify a foreign MNE that has undertaken inbound FDI in your home country. What does this MNE produce and in what ways has it been beneficial or non-beneficial for your home country?
Discuss the role of hr management in international strategy : Discuss the role of HR management in international strategy (with two articles:1- Going beyond hiring, firing and compensation and 2- Does your HR management support your International Strategy?)
Compute the expected osmotic pressure of ocean water : Ocean water typically contains 35 moles of salt ions dissolved in each 1000 moles of water. Assuming that ocean water has the same density as pure water convert this ratio into a molarity and calculate the expected osmotic pressure of ocean water.
Determine if the ct signal is periodic : Determine if the following CT signal is periodic. calculate the fundamental period T0 for the CT signal: x(t) = 2cos(4*pi*t/5)*sin^2(16t/3)

Reviews

Write a Review

Basic Statistics Questions & Answers

  Histogram for gaussian normal random variable

Show the histograms and calculate their means and variances and comment on your findings.

  Z-score calculations for statistics students

The weight of cans of fruit is normally distributed with a mean of 1,000 grams and a standard deviation of 50 grams. What percent of the cans weigh 860 grams or less?

  Difference between causal model and time- series model

What is the difference between a causal model and a time- series model? Give an example of when each would be used. What are some of the problems and drawbacks of the moving average forecasting model?

  Probability using continuous frequency distribution

For an arch chosen at random in Arches National Park, use the preceding information to estimate the probability that the height of the arch poening is:

  Generate a simple linear regression model and interpret it

Number of farms (X) and the average size of a farm (Y) in the United States between 1950 and 1997. Specifically, generate a simple linear regression model and interpret it.

  Probability using normal distribution-z score

What was the cost for the 10 percent of employees who incurred the highest dental expense?

  Average forecast method

Compute a 5-month moving average forecast for June through January.

  Determine number of left handers in the sample

The proportion of left handers is 0.10. What is the number of left handers in the sample and what notation is given to that number? What is the values of p and ^p?

  Surveys about attitudes of americans

Assume a sample of 400 American adults were taken. Show the sampling distribution of the proportion of adults who balance their checkbook at least once a month.

  Description of statistics-psychology

You want to determine whether or not an observational coding system you've created for ADHD is better as a system with 5 behavioral scales or 3 behavioral scales. What test should be run?

  Interpret confidence interval and write sentence to explain

Find a 95% confidence interval for the true proportion of patients who experienced cotton mouth. Show your calculations and/or explain the process used to obtain the interval.

  Association between maternal age and birth weight

A small pilot study is being conducted to determine the association between maternal age and birth weight. First, from all the single births in 2009 at Hospital X with mothers aged ? 20 years, we randomly selected 15 records.

Free Assignment Quote

Assured A++ Grade

Get guaranteed satisfaction & time on delivery in every assignment order you paid with us! We ensure premium quality solution document along with free turntin report!

All rights reserved! Copyrights ©2019-2020 ExpertsMind IT Educational Pvt Ltd