Generate plots for a couple of arbitrary ranges

Assignment Help Applied Statistics
Reference no: EM131415073

Lab Description

You will generate random sequences responding to several probability mass functions studied in class

Perform the following tasks:
1. Implement a function, my_rnd_generator, that returns a sequence of N random numbers. The function should accept the following arguments:
N: an integer specifying how long the sequence of random numbers will be.
v: a vector that corresponds to the sample space of the random variable.
p: a vector that corresponds to the probabilities for each element in v.

For example, to generate a vector, r, that corresponds to 10,000 outcomes of tossing a fair die, you should call the function as follows
N = 10000;
v = [1 2 3 4 5 6];
p = ones(1,6)/6;
r = my_rnd_generator(N,v,p);

To generate the biased die toss from lab 3, the function should be called as follows:
N = 10000;
v = [1 2 3 4 5 6];
p = [.1 .1 .1 .1 .1 .5];
r = my_rnd_generator(N,v,p);

Note that your function should adjust automatically for pmfs of various lengths (i.e. not only length 6) and shapes (i.e. not only uniform).

Hint: There are many ways to do this, including existing Matlab functions. You can use anything you want. One way to go about it is using the code below (by Kurt Hornik, used in Octave, a free software very similar to Matlab):
u = rand (1, n);
m = length (p);
s = reshape (cumsum (p / sum (p)), m, 1);
rnd = v (1 + sum ((s * ones (1, n)) <= ((ones (m, 1) * u))));
You may use any part of this code, or a variation of it, but of course I expect a detailed explanation of how it works.

2. For a random variable uniform in the range [a, b], generate a random sequence, r, of at least 100,000. Calculate the following:
a. Theoretical mean, μ.
b. Theoretical variance, σ2.
c. Sample mean, μs, i.e. average of all samples in r. Verify your result using Matlab'smean() function.

d. Sample variance, σ2s, i.e. average of all squared samples in r, minus the square of the sample mean. Verify your result using Matlab'svar()function.

e. In a figure partitioned in a 3×1 grid, plot the following:

i. The first 100 samples in r.Note that plotting all of the samples would not generate a very interesting figure.

ii. The theoreticalpmf, also showing μ and σ2.

iii. The histogram of r, also showing μs and σ2s. Note that the histogram should be very similar to the pmf (since you used at least 100,000 samples.

An example for U(-12,4), i.e. uniform discrete random variable for the inclusive interval [-12, 4], is shown in Figure 1. Please make sure that you display your results exactly as shown in Figure 1. To generate a title for the whole figure, you may use the function suplabel.m. This function is attached in Appendix A. For the example, I used the following code to invoke suplabel:

tt = ['N = ', num2str(N),', Uniform RV, U(',num2str(a),...
',',num2str(b),')'];
suplabel(tt,'t');

f. Generate plots for a couple of arbitrary ranges, including the [12, 4] Iused in the example.

1561_Figure.jpg

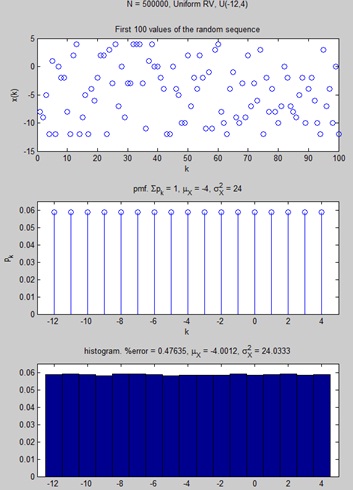
Figure 1. Example for part 2.

Note: You can embed greek letters in Matlabtitles and labels by typing a backward slash followed by the greek letter. For example, \Sigma for Σ and \sigma for σ. Use _ and ^ for subscripts and superscripts, respectively. For example \sigma_X^2 generates σX2

3. Repeat step 2 for the binomial distribution. Generate plots for:

a. n=24 and p = 0.2, 0.5 and 0.9, respectively.

b. Two more values for n with a at least a couple of different p values.

4. Repeat step 2 for the geometric distribution. Note that the sample space of the geometric random variable extends to infinity. Please cut of your plots at, say, n=50. If you sum over all 50probabilities in your pmf, you will not get 1, as you are ignoring the low probability samples for k>50. It will be interesting to observe how the plot varies for different ps. Generate plots for p = .1, .2, .5 and .7. What happens if you let p = 0.01 while maintaining n=50?

5. Repeat step 2 for the Poisson distribution. Once again, cut off your plots at n=50. Generate plots for α = 0.5, 3, 9, 24, and 40.

Attachment:- Appendix.rar

Verified Expert

The work is about random number generator using MATLAB. This work has been divided in five parts. In part 1 based on random number generation using probability and sample space. In part 2 based on random number generation which includes calculation for mean, In part 3 based on random number generation which includes calculation for mean, variance, pmf calculations.In part 4 based on random number generation which includes calculation for mean, variance, pmf calculations, plots for the various parts calculated based on geometric random number generation. In part 5 based on random number generation which includes calculation for mean, variance, pmf calculations, plots for the various parts calculated based on Poisson random number generation.

Reference no: EM131415073

Questions Cloud

Enhance the number of millennial leaders : Examine the best practices that your team can cultivate to enhance the number of millennial leaders. Explain how you would present this information to senior managers in your organization.
Acquisition of information-processing technology : What trade-offs are involved in (a) sharing information with other organizations in a supply chain and (b) the acquisition of information-processing technology? Who needs to be involved in decisions as they pertain to technology acquisition for suppl..
Use the three-sphere model for systems management : Think of a recent change that occurred at your college, in your community, or in the news. Use the three-sphere model for systems management and brainstorm issues related to the change based on the business, technology, and organization spheres.
Write on a topic that makes the naval profession stronger : Write on a topic that makes the naval profession stronger. Identify opportunities to better use enlisted professionals' talents. Share leadership best practices. Improve tactical doctrine.
Generate plots for a couple of arbitrary ranges : ENGR383 - APPLIED STOCHASTIC PROCESSES - Generate random sequences responding to several probability mass functions studied in class - Implement a function, my_rnd_generator, that returns a sequence of N random numbers.
Discuss the powers of bureaucracies : Discuss the powers of bureaucracies. What are their sources of power and influence? How is their influence legitimated? How can they be restricted or reined in if they exceed their authority? How are they utimately held accountable?
Entry strategy and strategic alliances : For much of its 144-year history, Diebold Inc. did not worry much about international business. As a premier name in bank vaults and then automated teller machines (ATMs), the Ohio-based company found that it had its hands full focusing on U.S. finan..
Can all non-state actor threats be addressed unilaterally : Can all non-state actor threats be addressed unilaterally as a non-traditional threat to only one country? Do some of these non-traditional threats span borders and require international cooperation to counter the threat?
Describe the behaviors linked with this style : Explain the opportunistic style and how it is derived from the managerial grid by answering the following: Describe the behaviors linked with this style. Provide at least 3 examples of well-known leaders who use the style.

Reviews

inf1415073

3/17/2017 5:07:21 AM

Cheerful to prescribe you to my companions. I like the way that the rights to the work return to me once the undertaking is finished. Likewise, the entire procedure appeared to be composed such a great amount of superior to my past experience.

len1415073

3/6/2017 1:05:56 AM

This is a long lab, so I don’t want you to print anything.Via email, I expect your lab report in PDF format, and your code (i.e. a “.m” file with instructions to use it). Finally, you need to demonstrate your working code (at least a couple of plots for each RV) to the instructor to get credit for the lab. Signature page must be turned in with your report.

len1415073

3/6/2017 1:05:43 AM

You should turn in, via email, at least the following 4 items in a single, cohesive PDF document: 1. Explanation of the code you used to generate the random data. 2. All plots requested, with the corresponding very well documented Matlab code you used to obtain it. Of course I only need one sample matlab code for each of the distributions. For example, if you did ranges [-12, 4], [4,10], and [2,12] for the uniform distribution, I only need to see matlab code for one of the three. 3. Analysis/discussion of your code/results. Note that I do expect at least a brief explanation of what is a discrete random variable, what is a pmf, how/why the histogram relates to it, etc. Additionally, turn in via email to the instructor: 1. All Matlab code, with instructions on how to run it. The subject should be: “EENG 388 – Lab number – Your first and last name.”

len1415073

3/6/2017 1:05:09 AM

Please read the instructions carefully, the code should be written in Matlab. I need two files, lab report with figures and matlab file ".m File" You may use any part of this code, or a variation of it, but of course I expect a detailed explanation of how it works.

Write a Review

Applied Statistics Questions & Answers

  A large playlist consists of songs with times

A large playlist consists of songs with times which have mean 2 minutes ten seconds and standard deviation 15 seconds.

  Predictable relationship between verbal skills

A researcher would like to know whether there is a consistent, predictable relationship between verbal skills and math skills for high school students. A sample of 200 students is obtained and each student is given a standardized English test and a s..

  A marketing analyst in a large grocery store chain

A marketing analyst in a large grocery store chain

  Determine whether or not a productivity objective

A researcher is asked to determine whether or not a productivity objective (in dollars) of better than $75,000 per employee is possible. A productivity test is done involving 20 employees. What conclusion would you reach? The sales are as f..

  Find the probability that exactly 15 babies are female

Find the probability that - exactly two of the workers have been exposed to asbestos - Find the probability that exactly 15 babies are female.

  What do you think about the inference of a correlation

What do you think about the inference of a correlation between complexity and progress? How might these ideas have some relevance to how we think about and do History? How might the influence of these ideas be seen in our present understanding of ..

  What are the main objectives of experimental design

What are the main objectives of Experimental Design - What is Randomization? List the situation in which randomization is very important.

  Share one real-world binomial distribution situation

Share one real-world binomial distribution situation and one real-world Poisson distribution situation. Be sure to explain why each example is defined as binomial or Poisson. How would you characterize the difference between the two types of distribu..

  Create the indicator variables

Create the indicator variables, the raw data does not include these - calculate a difference in the gscores between the consecutive rows; this is how we know if the Gleason score has increased since the last biopsy, which is one of the indicators f..

  Problem1 the data below shows the number of absences x and

problem1 the data below shows the number of absences x and the final grade y of seven students in the statistics

  Consider the covariance stationary time series

Consider the covariance stationary time series that satisfy the stochastic difference equation

  What is the pearson-tukey discrete approximation

The CDF of a certain random variable is given by F(x)= 1-9/(3+x)^2  where x>=0 What is the pearson-tukey discrete approximation for this distribution

Free Assignment Quote

Assured A++ Grade

Get guaranteed satisfaction & time on delivery in every assignment order you paid with us! We ensure premium quality solution document along with free turntin report!

All rights reserved! Copyrights ©2019-2020 ExpertsMind IT Educational Pvt Ltd