First save this file to your computer answer each of the

Assignment Help Applied Statistics
Reference no: EM13382668

First save this file to your computer. Answer each of the following questions, then resave the file along with your answers and turn it in using the assignment link in Module 3, Activity 4.the first four problems are worth 10 points each. Problems 5 and 6 are worth 30 points each.

1. If the original sample is 48, 55, 43, 61, 39, which of the following would not be a possible bootstrap sample? Explain why it wouldn't be.

a) 48, 55, 43, 61, 39

b) 43, 39, 56, 43, 61

c) 55, 48, 55, 48, 61

d) 39, 39, 39, 39, 39

2. The following bootstrap output is for mileage of a random sample of 25 mustang cars.

699_What is the difference in proportions in the original data.png

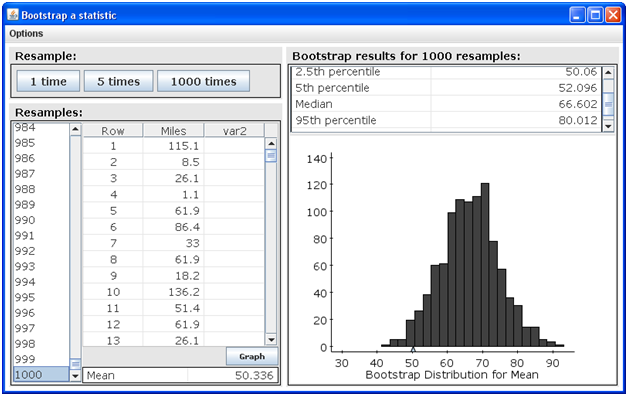
Based on a 90% confidence interval, which of the following would not be a plausible value of the population mean, µ? Explain why it wouldn't be.

a) 60.01

b) 80.01

c) 55

d) 52

3. Which of the following p-values would provide more evidence in support of the alternate hypothesis and against the null hypothesis? Explain your answer.

a) 0.15

b) 0.85

c) 0.009

d) 0.05

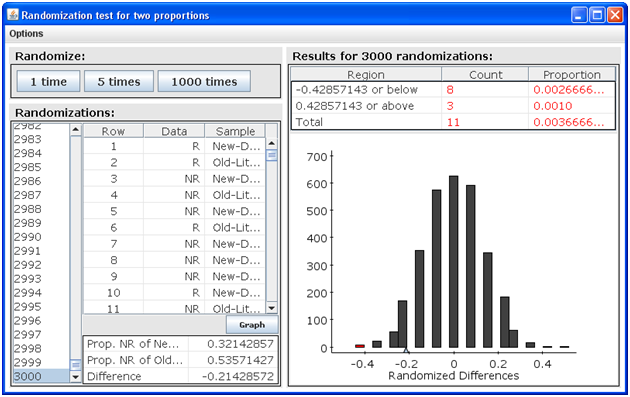
4. In a sample of 56 addicts, 28 were given a new drug to help them overcome their addiction, while the remaining 28 were given the current drug. The following is the output from a randomization test for the difference in the proportion of addicts suffering relapses.

a) What is the difference in proportions in the original data?

b) What is the p-value and what does it mean in terms of this specific problem?

1564_What is the difference in proportions in the original data1.png

In StatCrunch Assignment 1A, you selected a random sample of 30 StatCrunch U students and gathered some survey data regarding those students. Use the StatCrunch data file you created to complete the remainder of this assignment.

5. Construct a bootstrap distribution of the credit card debt data from your sample using 3000 resamples.

a) Paste a copy of your distribution here. (With a PC, you can press the control-alt-fn-F11 keys to copy the window showing the distribution.)

b) What is the mean of your original sample?

c) What is the 95% confidence interval estimate of the population mean obtained from your bootstrap distribution?

6. Suppose you want to compare the amount of credit card debt for males and females. The null hypothesis for this problem would be no difference in the mean amount of credit card debt for males and females and the alternate hypotheses would be that there is a difference in mean amounts of credit card debt.  Conduct a randomization test for two means with 3000 randomizations. (Your input menu should be as follows.)

420_What is the difference in proportions in the original data2.png

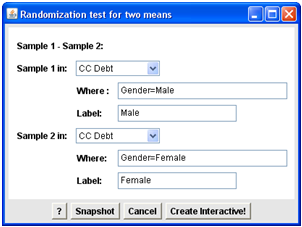
a) Paste the output from your randomization test here.

b) What is the mean difference in credit card debt of the two groups in the original data?

c) What p-value did you get in your randomization? Explain in the context of the problem what the p-value means.

d) Do you think the data support the null hypothesis of no difference in mean credit card debt between males and females or the alternate hypothesis that there is a difference? Explain your answer.

Reference no: EM13382668

Questions Cloud

The income tax return may be prepared manually or using the : the income tax return may be prepared manually or using the software or some other federal income tax or information
A rental car manager estimates the number of full-size : a rental car manager estimates the number of full-size sedans rented per week 5 so that she can maintain adequate
What is the relationship between motivation and job : what is the relationship between motivation and job satisfaction?are satisfied employees more productive? can most
Debate and argument paper apa format sources cited topic : debate and argument paper apa format sources cited topic developing leaders what determines whether nature or nurture
First save this file to your computer answer each of the : first save this file to your computer. answer each of the following questions then resave the file along with your
1 at the bottom left side of the applet set n equal to 10 : 1. at the bottom left side of the applet set n equal to 10 and then check the animate box. now click on flip. record
Desired consumption is cd 100 08y - 500r - 05g and : desired consumption is cd 100 0.8y - 500r - 0.5g and desired investment is id 10 - 500r. real money demand is mdp y
Sppose that the firms initial demand curve had been p : suppose that the firms initial demand curve had been p 5000 - 50q and that it shifted inward to p 4000 - 50q. assume
Name other examples of agricultural products that have : name other examples of agricultural products that have attempted to differentiate themselves.how have they

Reviews

Write a Review

Applied Statistics Questions & Answers

  A new program is developed to enrich

a new program is developed to enrich thekindergarteneperience of children in prepararion doe first grade. hillmont

  Develop a 95 percent confidence interval

Develop a 95% confidence interval estimate of the population mean sales price and population mean number of days to sell for Gulf View condominiums. Interpret your results.

  Comment on the production control situations

Comment on the production control situations depicted by the four control charts shown on the following page, and state what action, if any, would be necessary in each case.

  Comparison of probabilities in your explanation

How many free premium channels should the research director recommend for inclusion in the 3-For-All service ?

  Part 1- calculus has many uses in real life discovered

part 1- calculus has many uses in real life. discovered simultaneously by sir isaac newton and gottfried wilhelm

  Problem1 1 using if filter the data for these students

problem1 1. using if filter the data for these students into a column which contains the heights of only female

  Question 1nbspnbsp a large shipping company recorded the

question 1nbspnbsp a large shipping company recorded the number of tons shipped weekly across the pacific for 50

  1 the study you will evaluate for your assignment isbinge

1. the study you will evaluate for your assignment isbinge drinking and alcohol-related behaviours amongst pacific

  Drawing a straight line through the data

Develop a scatter diagram for these data. Try to approximate the relationship between x and y by drawing a straight line through the data.

  Problems based on probability

What is the probability in the sample?

  Define the hypothesis and find the standard error

Define the hypothesis and find the standard error of the difference in the means also find the test statistic - Determine the required sample size to be able to use a 99% confidence interval.

  Evaluate the volumetric flux

Prepare a Scilab script to evaluate the volumetric flux of smoke in a plume produced by a fire of given HRR Q' The plume loses α percent of its heat by radiation and β percent by other means.

Free Assignment Quote

Assured A++ Grade

Get guaranteed satisfaction & time on delivery in every assignment order you paid with us! We ensure premium quality solution document along with free turntin report!

All rights reserved! Copyrights ©2019-2020 ExpertsMind IT Educational Pvt Ltd