Find the value of the test statistic

Assignment Help Basic Statistics
Reference no: EM132338000

Inferences about Two Population Proportions Assignment -

Q1. In a recent survey, the following question was included: "How many tattoos do you currently have?" Of the n1 = 1200 males surveyed, x1 = 180 responded that they had at least one tattoo. Of the n2 = 1100 females surveyed, x2 = 140 responded that they had at least one tattoo. Use a hypothesis test at the level α = 0.05 to test whether there is a difference in the population proportions of men and women who had at least one tattoo.

(a) Write the null and alternative hypotheses.

(b) Find the sample proportion of males in the survey who reported having at least one tattoo: p ^1 =

Find the sample proportion of females in the survey who reported having at least one tattoo: p ^2 =

(c) Using the 2-PropZTest on your calculator, find the value of the test statistic.

(d) Give the p-value.

(e) State your decision.

(f) State your conclusion about the population proportions.

(g) Use the 2-PropZInterval to construct a 95% confidence interval for the difference in proportions. Then interpret it using the template on the notes page. (Remember the 2nd sentence because there are 2 samples).

Q2. On April 12, 1955, Dr. Jonas Salk released the results of clinical trials for his vaccine to prevent polio. In these clinical trials, 400,000 children were randomly divided in two groups. The subjects in group 1 (the experimental group) were given the vaccine, while the subjects in group 2 (the control group) were given a placebo. Of the 200,000 in the experimental group, 33 developed polio. Of the 200,000 children in the control group, 115 developed polio.

Follow the instructions below to perform a hypothesis test on whether the polio vaccine was effective. Use the significance level α = 0.01. Since group 1 received the polio vaccine, and group 2 received the placebo, and we expect the vaccinated children to get polio LESS often, the hypotheses are

H0: p1 = p2

H1: p1 < p2

(a) Using the 2-PropZTest on your calculator, find the value of the test statistic.

(b) Give the P-value. (This value is very small; you may use scientific notation)

(c) State your decision

(d) State your conclusion about the proportions of kids that contract polio.

Q3. Interpret calculator display: The following TI-84 Plus calculator display presents the results of a hypothesis test for the difference between two proportions. The sample sizes are n1 = 71 and n2 = 62.

1767_figure.png

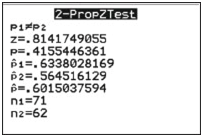
a. Is this a left-tailed test, a right-tailed test, or a two-tailed test?

b. What is the P-value?

c. What is the decision at the α = 0.05 level?

Q4. Interpret calculator display: The following TI-84 Plus calculator display presents a 95% confidence interval for the difference between two proportions.

434_figure1.png

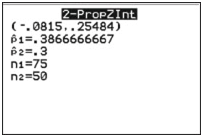
a. Compute the point estimate of p1 - p2.

b. Fill in the blanks: We are 95% confident that the difference between the proportions is between _____________ and _______________.

Reference no: EM132338000

Questions Cloud

Describe difference of research in graduate thesis : Describe difference of research in graduate thesis and research used by corporation of institution
Can the tax accountant accept these words at face value : What has been your first impressions of this course so far? Which course materials stand out to you the most - explain to the owner that if the auto
Differences between management and leadership : Considering the differences between management and leadership, are true leaders born or do we have the capability to learn how to lead?
What strategies might nurses use to have their voices heard : What strategies might nurses use to have their voices heard? Write a 300 - word paper using APA Format. Must follow the APA format.
Find the value of the test statistic : Inferences about Two Population Proportions Assignment - Using the 2-PropZTest on your calculator, find the value of the test statistic
Describe the current government policies : How can a nurse who is interested in a specific health care issue learn about current government policies and funding that affects it? Discussion cannot be.
How your education level impacts diversity of social network : How do you think your education level impacts the diversity of your social network? Use 250 Words. The response must be typed.
Define what benefits do you reap from your social network : What benefits do you reap from your social network? Are these benefits economic, social, and/or psychological? Use 250 Words. The response must be typed.
Evaluate the impact of introducing an e-commerce system : BTEC Level 5 HND Computing and Systems Development-Business Skills for E-Commerce-ULKOM BICYCLE HIRE -

Reviews

Write a Review

Basic Statistics Questions & Answers

  Statistics-probability assignment

MATH1550H: Assignment:  Question:  A word is selected at random from the following poem of Persian poet and mathematician Omar Khayyam (1048-1131), translated by English poet Edward Fitzgerald (1808-1883). Find the expected value of the length of th..

  What is the least number

MATH1550H: Assignment:  Question:     what is the least number of applicants that should be interviewed so as to have at least 50% chance of finding one such secretary?

  Determine the value of k

MATH1550H: Assignment:  Question:     Experience shows that X, the number of customers entering a post office during any period of time t, is a random variable the probability mass function of which is of the form

  What is the probability

MATH1550H: Assignment:Questions: (Genetics) What is the probability that at most two of the offspring are aa?

  Binomial distributions

MATH1550H: Assignment:  Questions:  Let’s assume the department of Mathematics of Trent University has 11 faculty members. For i = 0; 1; 2; 3; find pi, the probability that i of them were born on Canada Day using the binomial distributions.

  Caselet on mcdonald’s vs. burger king - waiting time

Caselet on McDonald’s vs. Burger King - Waiting time

  Generate descriptive statistics

Generate descriptive statistics. Create a stem-and-leaf plot of the data and box plot of the data.

  Sampling variability and standard error

Problems on Sampling Variability and Standard Error and Confidence Intervals

  Estimate the population mean

Estimate the population mean

  Conduct a marketing experiment

Conduct a marketing experiment in which students are to taste one of two different brands of soft drink

  Find out the probability

Find out the probability

  Linear programming models

LINEAR PROGRAMMING MODELS

Free Assignment Quote

Assured A++ Grade

Get guaranteed satisfaction & time on delivery in every assignment order you paid with us! We ensure premium quality solution document along with free turntin report!

All rights reserved! Copyrights ©2019-2020 ExpertsMind IT Educational Pvt Ltd