Reference no: EM131298422
Topic: Testing Hypothesis
I - TESTING "Goodness of Fit" and "Independence" using the Chi-Square Distribution
Exercise 1. In the past, 30% of the home-cinema screens sold by a store were small, 40% were medium, and 30% were large. In order to determine the inventory to maintain of each type of TV set, the manager takes a random sample of 100 recent purchases and finds that 18 were small-screen, 48 were medium, and 34 were large. How can the manager test at the 5% level of significance the hypothesis H0 that the past pattern of sales still prevails? [Testing goodness of fit]
Exercise 2. A car dealer has collected the data shown in Table 1 on the number of foreign and domestic cars purchased by customers "under 30 years old" and "30 and above". Test at the 1% level of significance if the type of cars bought (foreign or domestic) is independent of the age of the buyer, the car dealer constructs Table 2 of expected frequencies.
|
Table 1 - Observed Frequencies - Contingency Table for Car Buyers
|
|
|
Type of Car
|
Total
|
|
Foreign
|
Domestic
|
|
< 30
|
22
|
38
|
60
|
|
≥ 30
|
25
|
65
|
90
|
|
Total
|
47
|
103
|
150
|
Exercise 3. At Car-Hub Inc. the plant manager takes a random sample of 100 sick days and finds that 30% of the plant labour force in the 20-29 age group took 26 of this 100 sick days, that 40% of the labour force in the 30-39 age group took 37 sick days, that 20% in the 40-49 age group took 24 sick days, and that 10% of the 50-and-over age group took 13 sick days. How can the manager test at the 5% level of significance the hypothesis that age is not a factor in taking sick days? [Testing independence]. Hint: Construct one Table of observed frequencies of sick days using data here above, and one Table for expected frequencies pattern (fe) of sick days.
Exercise 4. The number of heart attacks suffered by males and females of various ages in a city is given by contingency Table here below. Test at the 1% level of significance the hypothesis that age and sex are independent in the occurrence of heart attacks.
|
Table - Observed Frequencies - Number of Heart Attacks of Males and Females in Various Age Groups in a City
|
|
Age Group
|
Male
|
Female
|
Total
|
|
< 30
|
10
|
10
|
20
|
|
30 - 60
|
50
|
30
|
80
|
|
> 60
|
30
|
20
|
50
|
|
Total
|
90
|
60
|
150
|
II - ANOVA using the F distribution
Exercise 5. Rousillon Inc. sells identical set of macaroons in three different packaging at the same price. The sales for six months are given in the Table here below. Sales data are normally distributed with equal variance.
The firm wants to test at the 5% level of significance whether the mean macaroons sales for each packaging is equal or not, i.e., H0: µ1 = µ2 = µ3 versus H1: µ1, µ2, and µ3 are not equal).
|
Packaging 1
|
Packaging 2
|
Packaging 3
|
|
81
|
78
|
84
|
|
76
|
80
|
75
|
|
83
|
81
|
81
|
|
79
|
79
|
81
|
|
81
|
79
|
83
|
|
80
|
77
|
82
|
|
480
|
474
|
486
|
(a) Find the mean output for each packaging and the grand mean for all the months and for all the three packaging's.
(b) Find the value of SSA, SSE, and SST;
(c) Find the degrees of freedom for SSA, SSE, and SST.
(d) Find MSA, the population variance estimated from the variance between the sample means.
(e) Find MSE, the population variance estimated from the variance within the samples.
(f) Find the F ratio.
(g) From the results obtained in part (a) to (f), construct an ANOVA table (see slides 21 and 25).
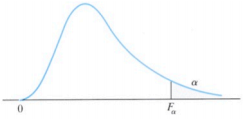
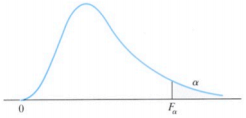
(h) Draw a figure showing the acceptance and rejection regions for H0.

Exercise 6. Organic fertilizers. Table-1 here below gives the output for 8 years of an experimental farm that used each of 4 fertilizers produced by four organic fertilizers. Assume that the outputs with each fertilizer are normally distributed with equal variance.
(a) Find the mean output for each fertilizer and the grand mean for all the years and for all four fertilizers.
(b) Estimate the population variance from the variance between the means or columns.
(c) Estimate the population variance from the variance within the samples or columns.
(d) Test the hypothesis that the population means are the same (µ1 = µ2 = µ3 = µ4) at the 5% level of significance.
|
TABLE 1. Eight-Year Outputs with 4 Different Fertilizers
|
|
Fertilizer 1
|
Fertilizer 2
|
Fertilizer 3
|
Fertilizer 4
|
|
51
|
47
|
57
|
50
|
|
47
|
50
|
48
|
61
|
|
56
|
58
|
52
|
57
|
|
52
|
61
|
60
|
65
|
|
57
|
51
|
61
|
58
|
|
59
|
48
|
57
|
53
|
|
58
|
59
|
51
|
61
|
|
60
|
50
|
46
|
59
|
|
Sum: 440
|
424
|
432
|
464
|
Exercise 7. Organic fertilizers
In reference to Exercise 6,
(a) Conduct the analysis of variance by testing at the 5% level of significance the hypothesis that the population means are the same, that's H0: µ1 = µ2 = µ3 = µ4.
(b) Draw a figure showing the acceptance and rejection regions for H0.

Attachment:- Assignment.rar