Reference no: EM131403095
Descriptive Statistics -
Note: All questions are compulsory. Answer in your own words.
Q1. State whether the following statements are true or false and also give the reason in support of your answer:
a) The average of n observations x1, x2, x3, . . . ,xn is v. If x1 is replaced by x', then the new average is v+x1-x'/n.
b) If each value of the variable X is divided by 5, then b'yx from coded values will be 5 times of the original value of byx.
c) If r(x, y) is the correlation coefficient between X and Y, the correlation coefficient between (ax + b) and y is "a×r(x, y) + b".
d) The correlation between five paired observations (3, 6), (½, 1), (2, 4), (1, 2) and (4, 8) for X and Y variables is equal to 0.5.
e) If with usual notations for two attributes the inequality (AB)(αβ) < (αB)(Aβ) holds, then -1 ≤ Q ≤ 1.
Q2. a) In the following table, distribution of students is shown according to their weights (in kg). Determine which class shows greater variation in weights?
|
Weight(kg):
|
20-30
|
30-40
|
40-50
|
50-60
|
60-70
|
|
Class A:
|
07
|
10
|
20
|
18
|
07
|
|
Class B:
|
05
|
09
|
21
|
15
|
06
|
Also find the coefficient of skewness for both series.
b) Find the average rate of
i) motion in case of a person who rides the first mile at 10 mile/hour, the next mile at 8 mile/hour and the third mile at 6 mile/hour ; and
ii) increase in population which in the first decade has increased 20%, in the second 25% and in the third 44%.
Q3. a) Ten competitors in a dance competition were ranked by three judges in the following orders:
|
Ist Judge
|
1
|
6
|
5
|
10
|
3
|
2
|
4
|
9
|
7
|
8
|
|
IInd Judge
|
3
|
5
|
8
|
4
|
7
|
10
|
2
|
1
|
6
|
9
|
|
IIIrd Judge
|
6
|
4
|
9
|
8
|
1
|
2
|
3
|
10
|
5
|
7
|
Determine which pair of Judges have the nearest approach to the common likings in dance.
When studying the relationship between two variables with 11 observations each, it was found that x = 7, σx = 2, y = 9, σy = 4, r = 0.5.
On verification one value of x(=7) and one value of y(=9) were found inaccurate and hence were removed from data. Find that how much the original value of r be affected?
Q4. a) In a state with a total population of 70,000 adults, 34, 000 are males and out of a total of 5000 graduates, 700 are females. Out of 1200 graduate employees of the state 200 are females. Is there any sex bias in education among people? The state holds that no distribution is made in appointments with respect of sex. How far this claim is substantiated by the data given above?
b) A census revealed the following figures of the blind and of the insane in two age groups in a certain population.
|
Age group
|
|
15-25 years
|
over 25 years
|
|
Total population
|
2,70,000
|
1,60,000
|
|
Number of blinds
|
1,000
|
2,000
|
|
Number of insanes
|
6,000
|
1,000
|
|
Number of insane among the blinds
|
19
|
9
|
a) Obtain a measure of the association between blindness and insanity in each of the age groups.
b) Do you consider that blindness and insanity are equally associated or disassociated with each other in two age groups or more in one-group than in other?
Q5. Two random variables have the regression lines
3x - 2 y = 26 and 6x + y = 31
i) Find the mean values of x & y and rxy.
ii) Also find out the ratio of two variances. In particular is σx = 4, what do you conclude about σy?
iii) Also show that the regression estimate of y for x = 0 is 13, where as the regression estimate of x corresponding to y = 13 is -3. Explain the cause of difference.
Q6. Find the equation of best fitted suitable curve of the form y = aebx for the following data:
|
x:
|
1
|
2
|
3
|
4
|
5
|
6
|
|
y:
|
1.6
|
4.5
|
13.8
|
40.2
|
125.3
|
300
|
Q7. a) Following are the observation made on 18 cotton plants with respect to the yield of cotton x1, number of seed-vessels x2 and height of the plant (x3)
x1: 10 51 30 42 25 18 44 56 38 32 25 10 20 27 13 49 27 55
x2: 8 15 11 21 07 05 10 13 12 13 5 6 4 8 7 12 6 16
x3: 4 5 3 3 2 1 4 6 3 4 2 3 4 4 3 5 3 7
Find the multiple and partial correlations. Also find the regression equation of x1 on x2 and x3.
b) In a very hotly fought battle at least 70% of the combatants lost an eye, at least 75% lost an ear, at least 80% lost an arm and at least 85% lost a leg. How many at least must have lost all four?
c) A market investigator returns the following data:
Of 1000 people consulted, 811 liked chocolates, 752 liked toffee and 418 liked boiled sweets, 570 liked chocolates and toffee, 356 liked chocolates and boiled sweets and 348 liked toffee and boiled sweets, 297 liked all three. Show that this information as it stands must be incorrect.
Q8. a) The first four moments of a distribution about the value 4 of the variable are -1.5, 17, -30 and 108. Find the moments about mean, β1 and β2.
Find also the moments about (i) the origin, and (ii) the point x = 2.
b) A number of school boys were examined for the presence or absence of the three physical defectives, viz., development defect denoted by A, nerve signs denoted by B and low nutrition denoted by C. Following data in terms of the ultimate class frequencies were observed: (ABC) = 149, (ABγ) = 738, (AβC) = 225, (Aβγ) = 1196, (αBC) = 204 (αBγ) = 1762, (αβC) = 171 and (αβγ) = 21842. Find all the class frequencies which are for the presence of defects.
Probability Theory
Note: All questions are compulsory. Answer in your own words.
Q1. State whether the following statements are True or False and also give the reason in support of your answer.
(a) If odds in favour of an event A are 3:5 then odds against of the event A will be 5:3.
(b) If two independent events A and B are such that P(A) 2/3 and P(B) 1/3 , then events A and A ∩ B are not independent.
(c) If a random variable X takes values 0, 1, 2 with probabilities 1/4, 1/2, 1/4 respectively, then F(1) = 3/4.
(d) If X denotes the waiting time in minutes until the 3rd customer arrives in a mobile showroom, then X follows exponential distribution.
(e) The probability that a shooter hits a target in Olympic is 1/3. If she fires 6 times, then to calculate the probability of hitting the target at least 3 times we can use geometric distribution.
Q2. (a) For answering a multiple choice question in a test, a student has two possibility: he/she knows the answer or guesses. Let ¾ be the probability that he/she knows the answer and ¼ be the probability that he/she guesses. Assuming that a student who guesses the answer will be correct with probability ¼. What is the probability that a student who knows the answer, given that he/she answered it correctly?
(b) A student has a questions bank consisting of 300 easy True/False questions, 200 difficult True/False questions, 500 easy multiple choice questions and 400 difficult multiple choice questions. If a question is selected at random from questions bank, what is the probability that it will be an easy question given that it is a multiple choice question?
Q3. (a) A continuous random variable X has density function f(x) = x + ½ for 0 < x < 1 and jointly distributed with a continuous random variable Y. If conditional density function of Y given X = x is
fY|X(y|X x) (x+y/x+ ½) for 0 < x < 1 and 0 < y < 1.
Then find fY(y).
(b) An unbiased die and an unbiased coin (having two numbers 1 and 2 on its faces) are thrown simultaneously. Find the expected value of the sum of numbers on them.
Q4. (a) A hospital has 20 kidney dialysis machines and the chance of malfunctioning any one of them during any day is 0.06. If someone want to find the probability that exactly 3 machines will be out of service on the same day. Then,
i) Can he/she use the binomial distribution to find this probability? If yes, calculate the probability.
ii) Can he/she use the Poisson distribution to find this? If yes, calculate the probability.
iii) If both, then compare the probabilities.
(b) During a particular period, a University's Information Technology Office received 20 service orders for problems with printers, of which 8 were laser printers and 12 were inkjet printers. A sample of 5 of these service orders is to be selected in a completely random fashion in a customer satisfaction survey. What is the probability that exactly 2 of the selected service orders were for inkjet printers?
Q5. An oil company conducts a geological study that indicates that an exploratory oil well should have a 20% chance of striking oil.
i) What is the probability that the first strike comes on the third well drilled?
ii) What is the probability that the third strike comes on the seventh well drilled?
iii) What is the mean and variance of the number of wells that must be drilled if the oil company wants to set up three producing wells?
Q6. (a) The magnitude of earthquakes recorded in a region modelled as having an exponential distribution, with a mean of 2.4 (as measured on the Richter Scale). Find the probability that an earthquake striking this region will:
i) exceed 3.0 on the Richter Scale and
ii) all between 2.0 and 3.0 on the Richter Scale
(b) Suppose that you spin the dial shown in the figure so that it comes to rest at a random position.
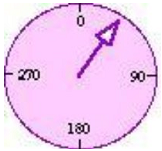
What is the suitable probability density function of this? Use it, to find the probability that the dial will land somewhere between 5° and 300°.
Q7. (a) In a college, it is known that 60% students reside in hostel and 40% are day scholars (not residing in hostel). Previous year results report that 30% of all the students who reside in hostel attained A grade and 20% of day scholar attained A grade in their annual examination. At the end of the year, one student is chosen at random from the college and he has an A grade, what is the probability that the student is hosteller?
A set of final examination grades in PGDAST programme is normally distributed, with a mean of 73 and a standard deviation of 8.
i) What is the probability of getting a grade below 91 on this exam?
ii) What is the probability that a student scored between 65 and 89?
iii) Compute the grade of a student, taking the test scores higher than that grade for which the probability is 5%.
8. A student is appearing in a multiple-choice exam in which each question has four choices. Assuming that she has no knowledge of the correct answers to any of the questions, she has decided on a strategy in which she will place four balls (marked A, B, C and D) into a box. The marking on the ball will determine her answer to the question. She randomly selects one ball for each question and replaces the ball in the box. There are five multiple-choice questions on the exam.
i) Find sample space of the correct answers.
ii) If X represents the numbers of correct answers, then find the probability distribution of X.
iii) Find the distribution function of the random variable X and draw its graph.
iv) What is the probability that she will get more than four questions correct?
v) What is the probability that she will get no more than two questions correct?
vi) If each question is of 2 marks, what is the expected value of the correct answers?
Statistical Inference
Note: All questions are compulsory. Answer in your own words.
Q1. State whether the following statements are True or False. Give reason in support of your answer:
(a) If sample size of a survey is increased 4 times, then the standard error will be doubled.
(b) If p-value and level of significance for testing a hypothesis, H0: P1 ≥ P2 against H1: P1 < P2, are 0.06 and 0.05, respectively, then the H0 may be accepted.
(c) A patient suffering from fever reaches to a doctor and suppose the doctor formulate the hypotheses as
H0: The patient is a chikunguniya patient
H1: The patient is not a chikunguniya patient
If the doctor rejects H0 when the patient is actually a chikunguniya patient, then the doctor commits type II error.
(d) A survey is planned to determine the mean annual family medical expenses of employees of a large company. For determining the minimum sample size, the management of the company requires only the knowledge of standard deviation of the annual family medical expenses of the previous years.
(e) For testing the pulse rate of one month old child is to be 120 per minute, a researcher measures (per minute) the pulse rate of 10 one month old children as 120,118,125,122,117,120,121, 126,125,115 and applies sign test and Wilcoxon signed- rank test, then power of the Wilcoxon signed-rank test is more than the sign test.
Q2. The following data represent the number of absent days in a year of 5 employees in a small company:
1 3 6 7 9
i) Assuming that you sample without replacement, select all possible sample of n = 2 and construct the sampling distribution of the mean.
ii) Repeat (i) for all possible samples of n = 3.
iii) Compare the shape of the sampling distribution of the mean in (i) and (ii). Which sampling distribution has less variability? Why?
Q3. (a) Find the mean and variance of the following sampling distributions:
i) f(t) = 1/π(1+t)2; -∞ < t < ∞
ii) f(Χ2) = 1/2e-Χ^2/2; 0 < Χ2 < ∞
(b) A sample of 500 shops was selected in a large metropolitan area to determine various information concerning the consumer behaviour. One question, among the questions, asked, was "Do you enjoy shopping for clothing?" Out of 240 males, 136 answered yes. Out of 260 females, 224 answered yes. Is there evidence of a significant difference between males and females in the proportion that they enjoy shopping for clothing at the 5% level of significance?
Q4. An ambulance agency claims that the standard deviation of the length of service times is 5 minutes. Investigator suspects that this claim is wrong. She takes a random sample of 20 services and finds the standard deviation as 6 minutes. Assume that the service time of the ambulance follows normal distribution.
i) What is the probability that the standard deviation of the length of service times is more than and equal to 5 minutes.
ii) Find the 95% confidence interval for the standard deviation of the length of service times.
iii) Test, at α = 0.01, is there enough evidence to reject the agency's claim?
Q5. The following data represent the distribution of number of sons among the children of 100 families containing 5 children each:
|
Number of Sons
|
0
|
1
|
2
|
3
|
4
|
5
|
|
Number of Families
|
4
|
23
|
38
|
23
|
10
|
2
|
Apply the suitable test to test whether the number of sons in a family follows uniform distribution at 5% level of significance.
Q6. Complete the following table, one is done for you:
|
S. No.
|
Test For
|
Name of the Test
|
Test Statistic
|
Assumptions for Applying the Test
|
Hypotheses and Decision Rule (in short)
|
|
1
|
Population mean when population variance is known and population is normal
|
Z-test
|
Z = X- -μ/σ/n-
|
1. Sample observations should be independent.
2. The measurement scale should be at least interval scale.
|
1. H0: μ = μ0 and H1: μ ≠ μ0 Reject H0, if z ≥ zα/2 or z ≤ -z α/2
2. H0 : μ ≤ μ0 and H1 : μ > μ0 Reject H0, if z ≥ zα
3. H0 : μ ≥ μ0 and H1 : μ < μ0 Reject H0, if z ≤ -zα
|
|
2
|
Population mean when population variance is unknown and population is normal
|
|
|
|
|
|
3
|
Population mean/median when the form of population is not known and sample size is small
|
|
|
|
|
|
4
|
Population mean when the form of population is not known and sample size is large
|
|
|
|
|
|
5
|
Population mean/median when the form of population is not known and the data is in ordinal scale and sample size is small
|
|
|
|
|
Q7. If the magnitude of the earthquakes recorded in a region of a country follows an exponential distribution with parameter è, then find
i) the maximum likelihood estimator of the parameter
ii) the maximum likelihood estimate of the parameter on the basis of the following data:
|
Magnitude of the Earthquakes (on the Richter scale)
|
6.7
|
7.7
|
5.6
|
7.3
|
6.7
|
6.6
|
7.8
|
6.7
|
6.2
|
5.2
|
iii) Show that obtained estimator is also sufficient estimator using invariance property of sufficiency.
8. A bank with a branch located in a commercial district of a city has developed an improved process for serving customers during the lunch period (noon-to-1 P.M). The waiting time (operationally defined as the time elapsed from when the customer enters in the line until he/ she reaches the teller window) needs to be shortened to increase customer satisfaction. A random sample of 15 customers is selected and measured the waiting time. The results (in minutes) are as follows:
4.21 5.55 3.02 5.13 4.77 2.34 3.54 3.20
4.50 6.10 0.38 5.12 6.46 6.19 3.79
Suppose that another branch, located in a residential area, is also concerned with the lunch period (noon -to-1 P.M.). A random sample of 15 customers is selected and the results (in minutes) are as follows:
9.66 5.90 8.02 5.79 8.73 3.82 8.01 8.33
10.49 6.68 5.64 4.08 6.17 9.91 5.47
i) Assuming that the population variances of the waiting time for both banks are equal, is there evidence of a difference in the mean waiting times between the two branches? (Use α = 0.05.)
ii) In addition to equal variances, what other assumption is necessary in (i)?
iii) If both assumptions in (i) and (ii) are not fulfilled, then which test is applied in this situation and why?
iv) Apply the test for (iii) and compare the result with (i).