Reference no: EM137785
1. A study was conducted to explore the relation between alcohol consumption and hypertension. 7400 nurses were surveyed and information about the amount of alcohol consumed per day (on average) and whether or not they suffered from hypertension was collected. The following table summarizes the information that was obtained.
Assuming the nurses surveyed were a simple random sample from the population of all nurses in the United States, the appropriate null hypothesis for these data is
A. the distribution of the average number of alcoholic drinks per day is the same for the population of nurses with hypertension and for the population of nurses who do not have hypertension.
B. the distribution of the presence of hypertension in nurses is the same for the populations of nurses who do not drink, nurses who drink 0.01 - 1.00 alcoholic drinks on average per day, nurses who drink 1.01 - 2.00 alcoholic drinks on average per day, and nurses who drink more than 2 alcoholic drinks on average per day.
C. the presence or absence of hypertension in nurses is independent of whether they do not drink, drink 0.01 - 1.00 alcoholic drinks on average per day, drink 1.01 - 2.00 alcoholic drinks on average per day, or drink more than 2 alcoholic drinks on average per day.
2. A study was performed to examine the personal goals of children in grades 4, 5, and 6. A random sample of students was selected for each of the grades from schools in Georgia. The students received a questionnaire regarding personal goals. They were asked what they would most like to do at school: make good grades, be popular, or good in sports. Results are presented in the table below by the sex of the child.
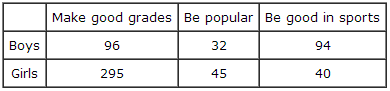
Make good grades Be popular Be good in sports
Boys 96 32 94
Girls 295 45 40
Suppose we wish to test the null hypothesis that there are no differences among the proportion of boys and the proportion of girls choosing each of the three personal goals. Under the null hypothesis, the expected number of boys that would select "be good in sports" is
A. 49.4.
B. 67.
C. 74.
|
How many visible-light photons are emitted
: If the average frequency emitted by a 200,-, rm W light bulb is 5.00 times 10^ {14}, {rm Hz}, and 10.0 percent of the input power is emitted as visible light, about how many visible-light photons are emitted per second.
|
|
Consumer surplus as well as industry profits
: Analyze the equilibrium cost and quantity in this case and label it on your graph. Moreover calculate, deadweight loss, consumer surplus as well as industry profits.
|
|
What is the mass of the sculpture
: A heavy piece of hanging sculpture is suspended by a 146.0 cm long, 8.03 gm wire. When the wind blows hard, wire hums at its fundamental frequency of 113.0 Hz. What is the mass of the sculpture (in kg) assume that the local acceleration due to gravit..
|
|
Effect on gold consumption and mining
: What is now the effect on gold consumption and mining of an increased use of gold as money.
|
|
Find the appropriate null hypothesis for these data
: Assuming the nurses surveyed were a simple random sample from the population of all nurses in the United States, find the appropriate null hypothesis for these data
|
|
Find out the wavelengths of the light
: A 16 cm x 16 cm square loop of wire lies in the xy-plane with its bottom edge on x-axis. The resistance of the loop is 0.490 ohms. A magnetic field parallel to the z-axis is given by B= 0.830 y^2 t, where B is in tesla, y in meters, and t in seconds...
|
|
Benefit-cost analysis of a government policy
: Explain the steps that would be used to conduct a Benefit-Cost Analysis of a government policy to alleviate the problem.
|
|
What is the heaviest weight
: A 346-, uniform, 1.04- bar is suspended horizontally by two vertical cables at each end. Cable A can support a maximum tension of 506.0 without breaking, and cable B can support up to 436.0. You want to place a small weight on this bar. What is the h..
|
|
Cutting taxes instead of increasing spending
: If the government wanted to achieve the same change in GDP as in part 8 by cutting taxes instead of increasing spending, how large would the tax cut need to be.
|