Find the age-dependency ratio for your selected region

Assignment Help Basic Statistics
Reference no: EM13946325

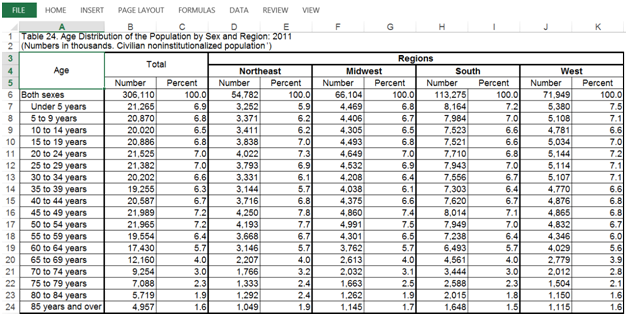
The 123 text covered dependency ratios for the total population of the United States. The snapshot below is a spreadsheet that also separates the population into regions.

1283_table2.png

1. You will need to select a region to use to complete the questions below. Refer to your book if necessary.

a. Which region will you be using for your calculations? ______________

2. Note the age groupings in the table, it will be helpful to regroup the ages to calculate dependency ratios.

a. What is the total population for the under-15 year olds for your region?

b. What is the total population for the 15-64 year olds for your region?

c. What is the total population for the over-65 year olds for your region?

3. Calculate the ratio of under-15 year-olds to the total population of the selected region.

a. What kind of ratio is this: a part to part or part to whole?

b. Write the ratio in at least 2 ways.

c. Use this ratio in a meaningful sentence.

4. Calculate the ratio of age 65-and-over to the total population of the selected region.

a. What kind of ratio is this: a part to part or part to whole?

b. Write the ratio in at least 2 ways.

c. Use this ratio in a meaningful sentence.

5. If you write the ratios from the last two questions as decimals and multiply 100 you can express the ratios as "per hundred" or a percent.

What percent of the total population would be classified as "child dependent"?_______

What percent of the total population would be classified as "old-age dependent"_______

6. Child dependency ratio.

a. Explain how to calculate a child dependency ratio(you may want to refer to your notes, this is not the same as what was calculated above).

b. Find the child dependency ratio for your selected region.

c. Use the ratio in a sentence to explain its meaning.

d. Write a sentence explaining the meaning of the ratio with your ratio expressed in a different way.

7. Old-age dependency ratio.

a. Explain how to calculate an old-age dependency ratio(you may want to refer to your notes, this is not the same as what was calculated above).

b. Find the old-age dependency ratio for your selected region.

c. Use the ratio in a sentence to explain its meaning.

d. Write a sentence explaining the meaning of the ratio with your ratio expressed in a different way.

8. Age-dependency ratio.

a. Explain how to calculate the dependency ratio (you may want to refer to your notes).

b. Find the age-dependency ratio for your selected region.

c. Use the ratio in a sentence to explain its meaning.

d. Write a sentence explaining the meaning of the ratio with your ratio expressed in a different way.

9. Analyze: Due to the baby boomers and extended life expectancy in the U.S., some say the age-dependency ratio should NOT include the 65-69-year-olds, because they are still in the workforce. Recalculate the age-dependency ratio using this new strategy. Compare your outcome to the age-dependency ratio found using the original strategy. Does the rate go up or down? Explain which is more "desirable"? What are some pros and cons associated with the two strategies? Please state your findings in complete and meaningful sentences.

Reference no: EM13946325

Questions Cloud

Create a context diagram using visio or powerpoint : Create a context diagram using Visio or PowerPoint based on the information provided. Write a narrative describing the diagram.
Minimum of four different sources for your materials : It's time to take what you've learned from all of your prior presentations and add an element of research to create your Informative Speech. You have to be cautious when choosing an Informative topic, as it's easy to think an Informative Speech an..
Calculate the grashof number : Calculate the Grashof number using Equation 9.65, which can be applied to natural convection flows driven by temperature and concentration gradients. Use a characteristic length L that is appropriate for the exposed surface of the water bath.
What typical problems in introducing business intelligence : What are the typical problems in introducing business intelligence tools that are described in the case study? What additional people-related problems do you think may arise when business intelligence systems are introduced for end-users?
Find the age-dependency ratio for your selected region : What is the total population for the 15-64 year olds for your region? What is the total population for the over-65 year olds for your region?
Parmalat or healthsouth : Consider the accounting problems described in our textbook for Parmalat or HealthSouth.
Y information technology professionals have a poor attitude : Discuss why many information technology professionals have a poor attitude toward project cost management
Minimum value of the convection heat transfer : In the limiting case of a very small sphere, what is the minimum value of the convection heat transfer coefficient expressed in terms of the sphere diameter and thermal conductivity of the air?
Analyze the various aspects of the methodology : In this assignment, you will describe and analyze the various aspects of the methodology of one of the following quantitative research articles: Okimoto and Heilman's 2012 article, "The 'Bad Parent' Assumption: How Gender Stereotypes Affect Reacti..

Reviews

Write a Review

Basic Statistics Questions & Answers

  Test whether music reduces studying capacity

Test whether the music reduces studying capacity at a .05 level of significance.

  Calculate a 95 confidence interval for the coefficient of

timber yield is approximately equal to the volume of a tree however this value is difficult to measure without first

  Regression-predicted value and the actual price

What is the difference between this regression-predicted value and the actual price at the end of December 2000? What is your analysis of linear regression in stock-prediction scenarios?

  Suspecting automobile insurance premiums

We suspect that automobile insurance premiums (in dollars) may be steadily decreasing with the driver's driving experience (in years), so we choose a random sample of drivers who have similar automobile insurance coverage and collect data about th..

  Determining the maximum number of wheel bearings

Wheel-Rite has agreed to ship the maximum number of wheel bearings that it produces each day to Itex when an order has been received.

  Determine a point estimate of population mean

Determine a point estimate of population mean. Determine the 99% confidence interval of true mean weight of the minivans.

  Determining correlation and regression analysis

What are examples in which regression analysis is used for forecasting? What are some primary and secondary sources of data that may be used in correlation and regression analysis?

  Computed chi square and the critical chi square

Based on comparing the computed Chi square and the critical Chi square, which of the following is (are) true?

  Interpret the ß coefficients in the model

Write a main efforts model for E(y) as a function of gender and expert testimony. Interpret the β coefficients in the model.

  Probability of absenteeism

On a very hot summer day, 5 percent of the production employees at Midland States Steel are absent from work. The production employees are randomly selected for a special in-depth study on absenteeism.

  Mcdonalds waiting times you want to estimate sd for the

mcdonalds waiting times. you want to estimate sd for the population of waiting times at mcdonalds drive up windows. you

  A sample of shoppers was selected and asked questions

a sample of shoppers was selected and asked questions regarding consumer behavior. one of the questions asked was do

Free Assignment Quote

Assured A++ Grade

Get guaranteed satisfaction & time on delivery in every assignment order you paid with us! We ensure premium quality solution document along with free turntin report!

All rights reserved! Copyrights ©2019-2020 ExpertsMind IT Educational Pvt Ltd