Find news articles ranking the states from best to worst

Assignment Help Basic Statistics
Reference no: EM131638382

Question: The news media have a weakness for lists. Best places to live, best colleges, healthiest foods, worst-dressed women a list of best or worst is sure to find a place in the news. When the state-by-state SAT scores come out each year, it's therefore no surprise that we find news articles ranking the states from best (Iowa in 2007) to worst (District of Columbia in 2007) according to the average SAT score achieved by their high school seniors

The College Board, which sponsors the SAT exams, doesn't like this practice at all. "Comparing or ranking states on the basis of SAT scores alone is invalid and strongly discouraged by the College Board," says the heading on their table of state average SAT scores. To see why, let's look at the data.

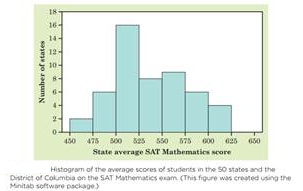
Figure shows the distribution of average scores on the SAT Mathematics exam for the 50 states and the District of Columbia. Iowa leads at 613, and the District of Columbia trails at 462 on the SAT scale of 200 to 800. The distribution has an unusual shape: it has one clear peak and perhaps a second, small one. This may be a clue that the data mix two distinct groups. But we need to explore the data further to be sure that this is the case

In this chapter we will learn that to understand one variable, such as SAT scores, we must look at how it is related to other variables. By the end of this chapter you will be able to use what you have learned to understand why Figure has such an unusual shape and to appreciate why the College Board discourages ranking states on SAT scores alone.
873_1.jpg

Reference no: EM131638382

Questions Cloud

Choose a consistent slide design for the entire presentation : Choose a consistent slide design for the entire presentation. Use at least one each of an entrance effect, exit effect, and emphasis effect.
Explain correlation between length and weight : Explain why you expect the correlation between length and weight to be positive.
Define basic cardiac life support : How can you assess the needs of this diverse group of learners, Define Basic Cardiac Life Support
What are all the values that correlation r can possibly take : What number can I be? What are all the values that a correlation r can possibly take?
Find news articles ranking the states from best to worst : The news media have a weakness for lists. Best places to live, best colleges, healthiest foods, worst-dressed women a list of best or worst is sure.
Analyse information security vulnerabilities : Analyse information security vulnerabilities and threats and determine appropriate controls that can be applied to mitigate the potential risks
Two re-payment options : 1. Let's suppose you are going to borrow $10,000 on October 1, 2017. You have two re-payment options:
Discuss protect the privacy of a client : What reasonable precautions must an organisation take to protect the privacy of a client. Discuss how using someone else's password might infringe
Discuss behavior rather than changing the system : Social marketing focuses on changing individual behavior rather than changing the system

Reviews

Write a Review

Basic Statistics Questions & Answers

  Difference in the proportions defective

Molded fiberglass parts are to be tested for defectives. Two different grades of fiberglass were used for the parts, and one is interested in testing for a difference in the proportions defective using a: = 0.05.

  Computing the mean and standard errors of sampling

computing the mean and standard errors of sampling distribution.using the central limit theorem find the means and

  A teacher asked 10 of her students how many books they had

a teacher asked 10 of her students how many books they had read in the last 12 months. their answers were as follows12

  Give a practical interpretation of the interval

Locate a 95% confidence interval for the true mean failure time of used colored display panels on the printout.- Give a practical interpretation of the interval, part a.

  Rank correlation utilizing excel

For the following assignment, use the Rank Correlation Utilizing ExcelUse a rank correlation coefficient to test for a correlation between two variables. Use a significance level of α=0.05.

  Creating adm-pert diagram of activities

Create ADM/PERT diagram. Determine the critical path.

  A closed-loop system with unity feedback

(a) Determine the gain K so that the phase margin is 45°. (b) For the gain K selected in part (a), determine the gain margin, (c) Predict the bandwidth of the closed-loop system.

  The hours of study and the final exam grades have this

the hours of study and the final exam grades have this type of relationship y 5.76hours 35.31. based on this linear

  Determining financial advisor

A financial advisor has recommended two possible mutual funds for investment: Fund A and Fund B. The return that will be achieved by each of these depends on whether the economy is good, fair, or poor.

  Determine probability flavor is carried by appleton-beacon

Probability that the flavor will be carried by Appleton or Beacon is 15/16. Determine the probability a flavor is carried by both Appleton and Beacon.

  Assume the random variable x is normally distributed with

assume the random variable x is normally distributed with mean u87 and a standard deviation o5. find the indicated

  Wageweb is a service of hrpdi and provides compensation

wageweb is a service of hrpdi and provides compensation information on more than 170 benchmark positions in human

Free Assignment Quote

Assured A++ Grade

Get guaranteed satisfaction & time on delivery in every assignment order you paid with us! We ensure premium quality solution document along with free turntin report!

All rights reserved! Copyrights ©2019-2020 ExpertsMind IT Educational Pvt Ltd