Explain why the correlation changed

Assignment Help Basic Statistics
Reference no: EM131742181

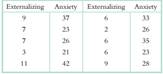
Question: A study on the relation between rejection and depression in adolescents conducted by one of the authors (Nolan, Flynn, & Garber, 2003) also collected data on externalizing behaviors (e.g., acting out in negative ways, such as causing fights) and anxiety. We wondered whether externalizing behaviors were related to feelings of anxiety. Some of the data are presented in the accompanying table.

729_Axes.png

a. Create a scatterplot of these data. Be sure to label both axes.

b. What does the scatterplot suggest about the relation between these two variables?

c. Would it be appropriate to calculate a Pearson correlation coefficient? Explain your answer.

d. Construct a second scatterplot, but this time add in the data for one more participant who scored 1 on externalizing and 45 on anxiety. Would you expect the correlation coefficient to be positive or negative now? Small in magnitude or large in magnitude?

e. The Pearson correlation coefficient for the first set of data is 0.65; for the second set of data it is 0.12.

Explain why the correlation changed so much with the addition of just one participant.

Reference no: EM131742181

Questions Cloud

Involved all of the company department heads in decision : Jenny was buying the company’s first digital copier, and she involved all of the company's department heads in the decision.
Define what is the poems purpose : What is the poem's purpose. Do you think the poem accomplishes its purpose. Why or why not
Keynesian or new keynesian models : Are your personal views most closely aligned with the classical, new classical, Keynesian or New Keynesian models? Why do you say that/ what tells you that?
Described some job relate critical moments : Described some job relate critical moments and how can one managed such situations?
Explain why the correlation changed : A study on the relation between rejection and depression in adolescents conducted by one of the authors (Nolan, Flynn, & Garber, 2003) also collected data.
Identify risks to both electronic and paper patient records : Identify risks to both electronic and paper patient records, and recommend remedies United General can put in place to protect the records from compromise.
What is the contribution margin ratio : What is the contribution margin ratio? Using the same information in Question 3, what is the material price variance for the month?
Frederick douglass comments on the effects of slavery : Frederick Douglass comments on the effects of slavery not only on actual slaves but also on slave-holder.
Decrease the social health status : Why increase in income inequality level leads to a reduction of the GDP and decrease the social health status? (Canada)

Reviews

Write a Review

Basic Statistics Questions & Answers

  Statistics-probability assignment

MATH1550H: Assignment:  Question:  A word is selected at random from the following poem of Persian poet and mathematician Omar Khayyam (1048-1131), translated by English poet Edward Fitzgerald (1808-1883). Find the expected value of the length of th..

  What is the least number

MATH1550H: Assignment:  Question:     what is the least number of applicants that should be interviewed so as to have at least 50% chance of finding one such secretary?

  Determine the value of k

MATH1550H: Assignment:  Question:     Experience shows that X, the number of customers entering a post office during any period of time t, is a random variable the probability mass function of which is of the form

  What is the probability

MATH1550H: Assignment:Questions: (Genetics) What is the probability that at most two of the offspring are aa?

  Binomial distributions

MATH1550H: Assignment:  Questions:  Let’s assume the department of Mathematics of Trent University has 11 faculty members. For i = 0; 1; 2; 3; find pi, the probability that i of them were born on Canada Day using the binomial distributions.

  Caselet on mcdonald’s vs. burger king - waiting time

Caselet on McDonald’s vs. Burger King - Waiting time

  Generate descriptive statistics

Generate descriptive statistics. Create a stem-and-leaf plot of the data and box plot of the data.

  Sampling variability and standard error

Problems on Sampling Variability and Standard Error and Confidence Intervals

  Estimate the population mean

Estimate the population mean

  Conduct a marketing experiment

Conduct a marketing experiment in which students are to taste one of two different brands of soft drink

  Find out the probability

Find out the probability

  Linear programming models

LINEAR PROGRAMMING MODELS

Free Assignment Quote

Assured A++ Grade

Get guaranteed satisfaction & time on delivery in every assignment order you paid with us! We ensure premium quality solution document along with free turntin report!

All rights reserved! Copyrights ©2019-2020 ExpertsMind IT Educational Pvt Ltd