Reference no: EM131836061
Project - Answer the following questions below in your own words.
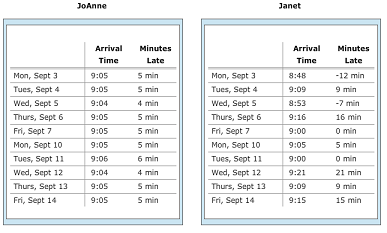
1. Suppose you are the CEO of a large school bus company. You just figured out that you have to let one of your drivers go. You want to use the objective criteria of on-time performance to decide which of your two most recent hires to lay off. Suppose the two most recent hires were both an average of five minutes late.
a. What kind of additional information might you want in order to decide which driver to lay off?
b. The records below show the actual arrival times for both drivers during the first two weeks of this school year. Using this information who would you choose to lay off?
c. What would be your explanation to the driver you laid off for your reasoning?
d. What if the drivers had been driving for several years, so that there were many hundreds of arrival times to consider in your decision? How would you analyze the data?
2. Consider a data set containing the following values:
The mean of the preceding values is 84.875. The deviations from the mean have been calculated as follows:
|
-24.875
|
8.125
|
-0.875
|
-4.875
|
10.125
|
14.125
|
-6.875
|
5.125
|
a. If this is sample data, what is the sample variance _________ and the standard deviation _________
b. If this is population data, what is the population variance _______ and the standard deviation _________
c. Suppose the largest value of 99 in the data was misrecorded as 999. If you were to recalculate the variance and standard deviation with the 999 instead of the 99, explain what would happen to the variance and standard deviation.
3. There are multiple ways to refer to or describe variance or a standard deviation of either a population or a sample. Likewise, each measure has multiple appropriate equations or symbols. The left table consists of alternative ways to referring to each of these measures. The right table consists of equations or symbols for each of these measures. For each of the following four measures, select one appropriate description from the left table (lettered) and one appropriate equation or symbol from the right table (numbered). Each answer will be used only once.

Measure Alternate Description Equation or Symbol
Sample standard deviation ____________ ____________
Sample variance ____________ ____________
Population standard deviation ____________ ____________
Population variance ____________ ____________
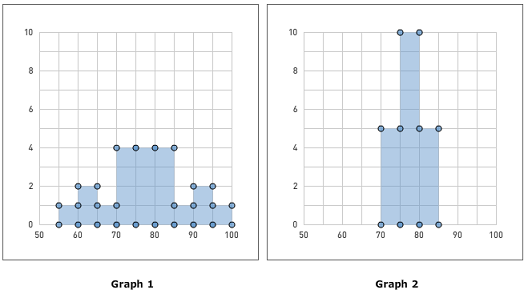
4. Suppose John just found out that he got a 71 on his statistics exam. He knows the mean was a 78, and he is trying to figure out whether he should be a) pleased about his score, because his score was so close to the mean, or b) worried, because his score was so far below the mean.
a. Which response do you think is most appropriate (not regarding either of the tables below)? How are you basing your information?
b. In order to get a true 'picture' of the test score you would need to analyze the distribution. From the graphs below, explain which graph represents John's score as a 'good' score and which graph represents his score as a 'bad' score. Explain your reasoning/justification.
c. As you can see, without a frame of reference, a raw score does not provide very much information. What else would be important to consider when analyzing your test scores?
5. Explain why/when it would be advantageous to convert raw scores into a converted score.
6. The International Average Salary Income Database provides a comparison of average salaries for various professions. The data are gathered from publications and reports obtained directly from government agencies (such as the U.S. Bureau of Labor Statistics) or from the International Labour Organization. Suppose an industrial/organizational psychologist is interested in the relationships between job satisfaction, job performance, and job compensation. She has data from five different countries on the average monthly salaries paid to accountants. She begins her analysis by converting all of the salary data into U.S. dollars:
|
Country
|
Average Monthly Salary (U.S. dollars)
|
Standard Deviation (U.S. dollars)
|
Original Currency
|
|
Brazil
|
$1,351
|
$337.80
|
real
|
|
The Unite States
|
$3,370
|
$1,011.00
|
dollar
|
|
China
|
$165
|
$24.80
|
yuan
|
|
Slovakia
|
$646
|
$96.80
|
Koruna
|
|
Kuwait
|
$2,697
|
$809.20
|
dinar
|
To appreciate the difference among the countries, she calculates the z-scores for an accountant making $1,500 per month.
a. Complete the table below:
|
Country
|
z-score for $1,500 salary
|
|
Brazil
|
|
|
The United States
|
|
|
China
|
|
|
Slovakia
|
|
|
Kuwait
|
|
b. Suppose an accountant in each of the five countries listed is offered a salary of $1,500 per month. Using the z-scores and assuming that the accountant prefers a salary that has a higher relative value, the accountant from which country will likely be the most pleased with the offer? Explain your reasoning/justification.